The Stock Scanner Dashboard Finally Looks Like a Real Trading Tool
In Part 5, I laid out the roadmap as a SIGINT fire-control problem: Broad Search, Target Acquisition, Target Lock, Fire. Wave 1 proved the architecture could swallow 1,490 messages per second at market close without flinching. Wave 2 is about deciding which of those tickers actually deserves my attention.
Three goals drove this iteration:
- A quote widget that tells me everything about a ticker without alt-tabbing to other tools.
- Streaming HOD/LOD alerts so I stop missing breakouts while I’m looking at something else.
- Just enough charting to triage tickers without bouncing to TradingView every thirty seconds.
Here’s what landed.
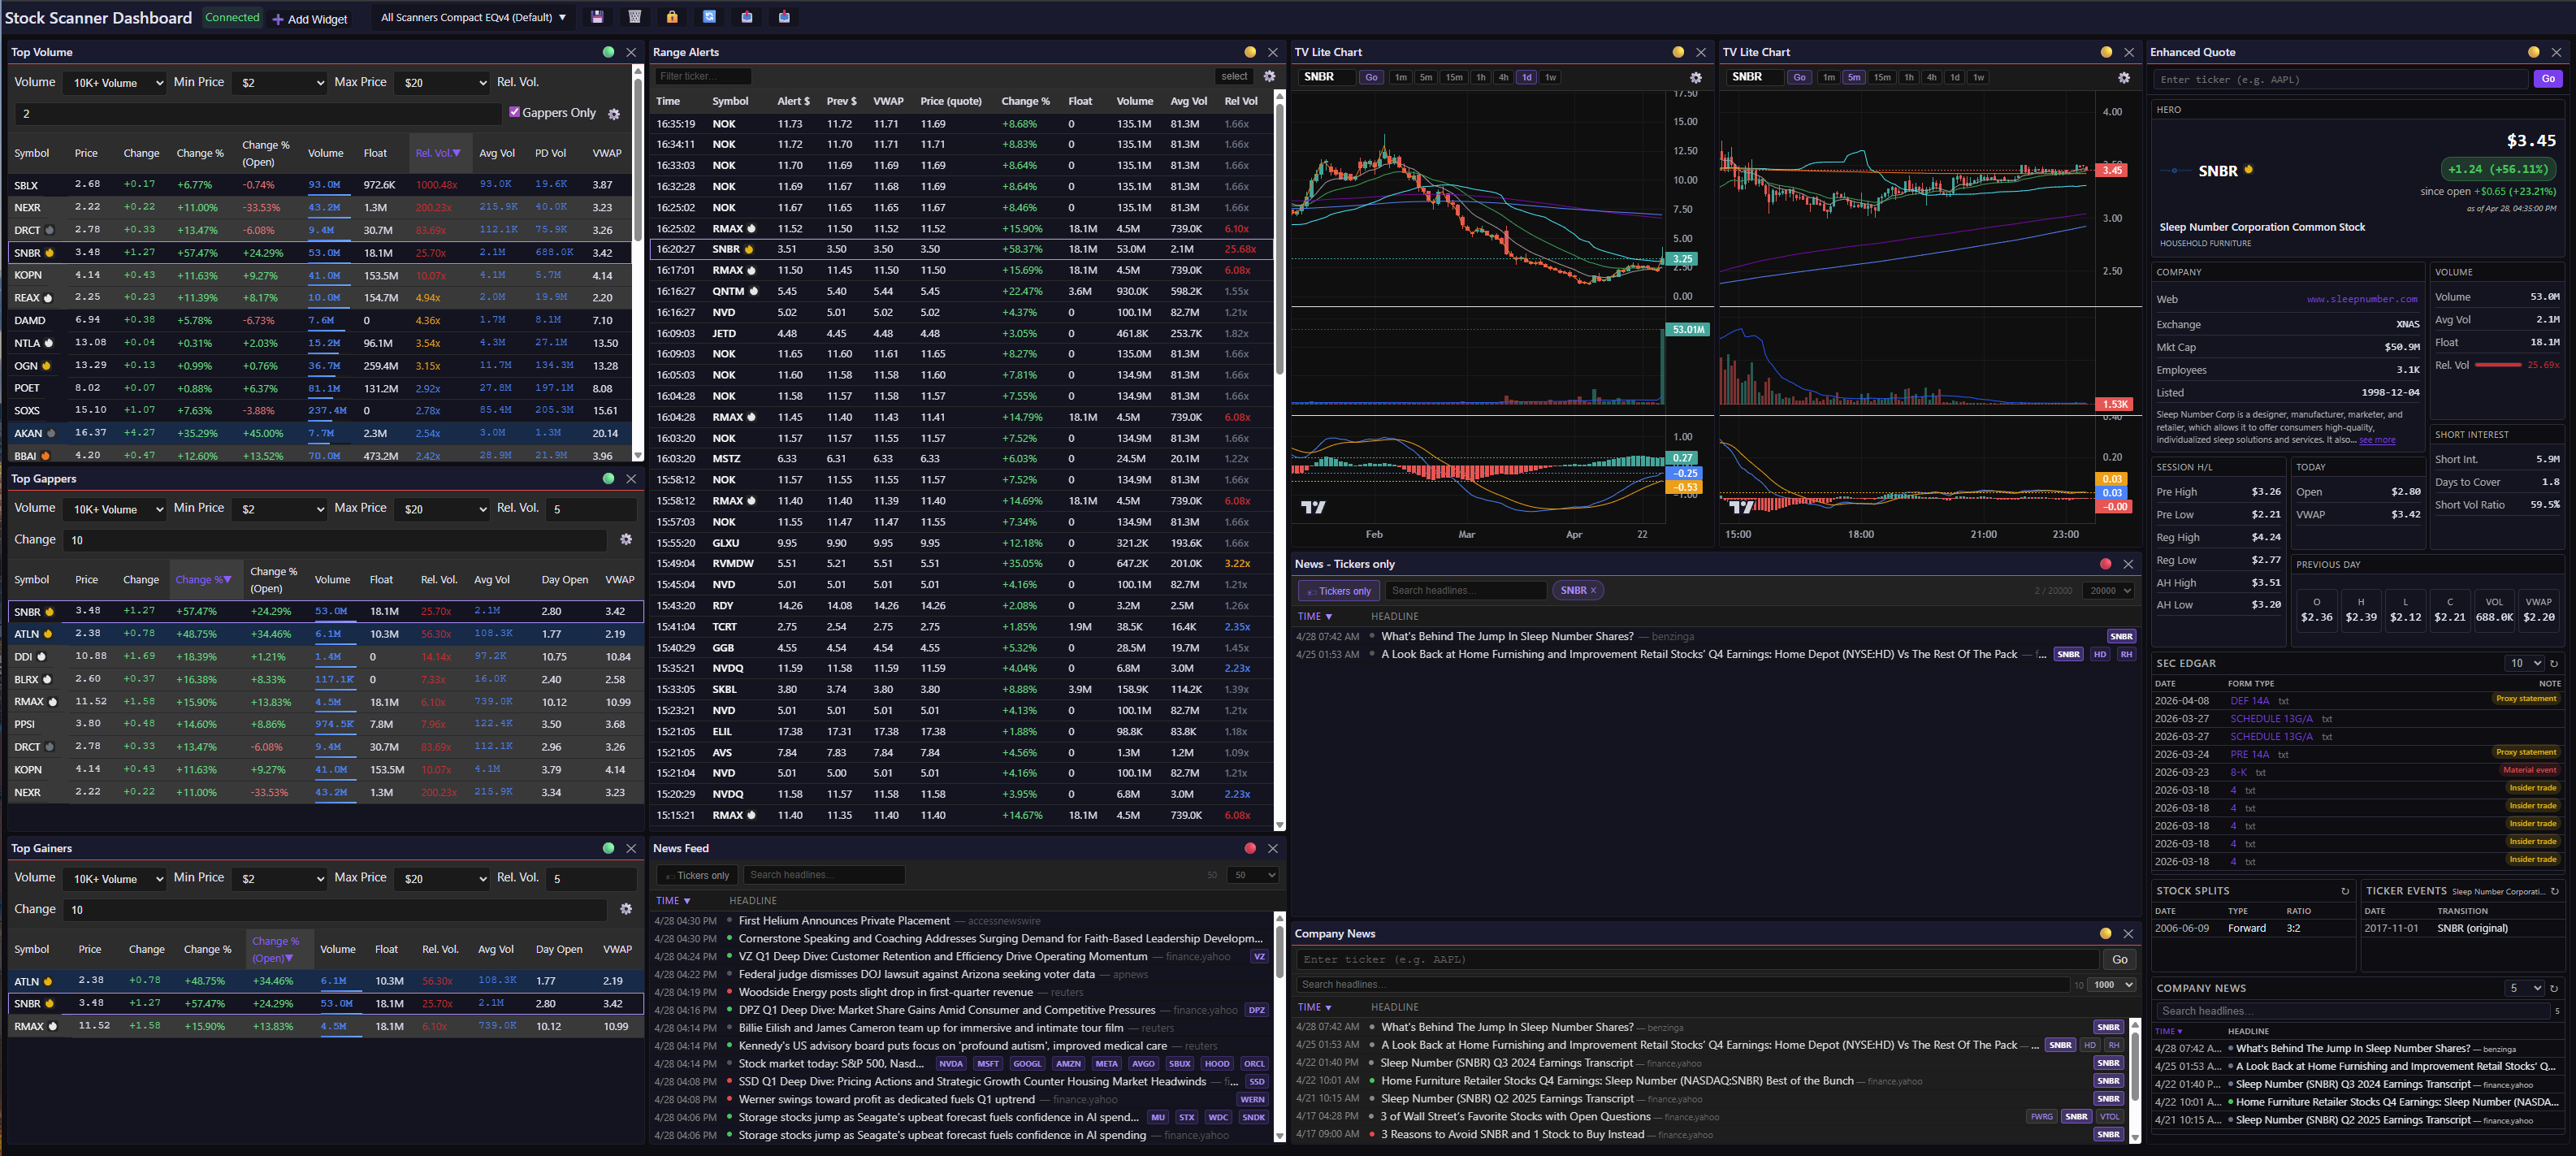
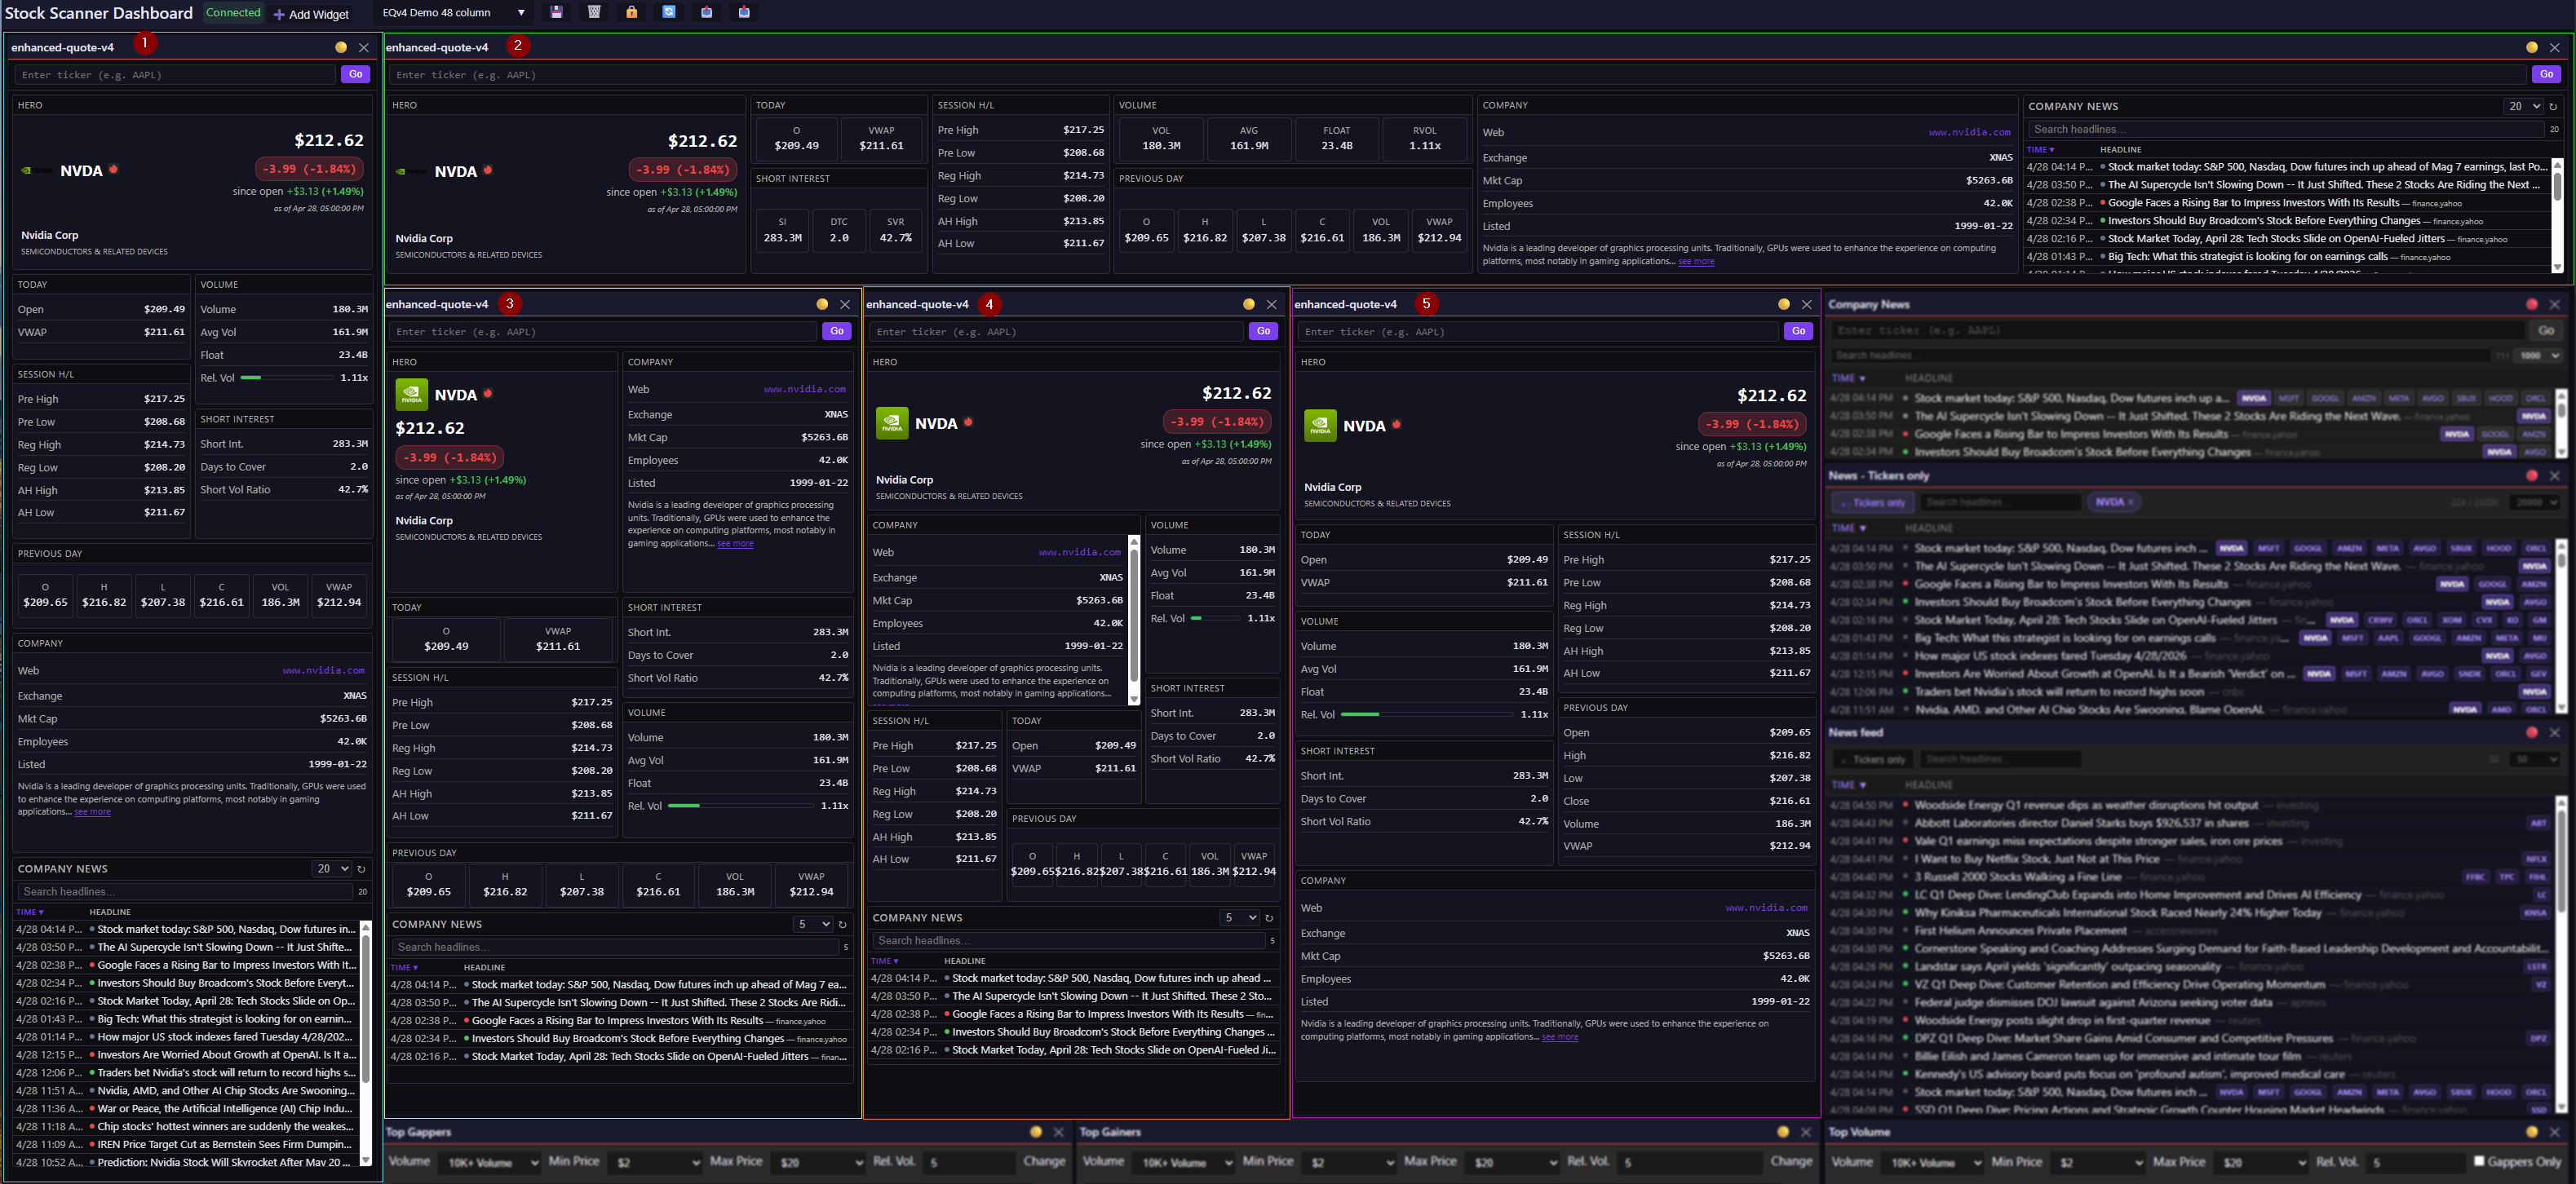
My default day trading layout. Damn near everything I need on one screen — and yes, that’s three different news widgets. I’m still figuring out which combination I actually use; the unfiltered News Feed stays unlinked on purpose so I always have one view that isn’t pinned to a single ticker. Everything else pivots in lockstep when I click a row in Range Alerts, click a row in any scanner, or type a ticker into the quote widget. (TV Lite charts shown.)
The Data Plane Gets a New Scanner
Wave 2 introduces a new server: the Market Data Scanner (MDS). The MDS consumes the streams emitted from the Market Data Processors (MDP) and, like MDP, uses pluggable analyzers. This wave introduces the first one: DailyRangeAnalyzer (DRA). It tracks high-of-day and low-of-day across every session and emits to three feeds: daily_range:{ticker}, daily_range_hod_alert, and daily_range_lod_alert. The new enhanced quote and range alert widgets are fed by these.
The lesson from Wave 1 was that a pluggable data plane is worth the up-front pain. The MDS/DRA pairing follows that pattern: it’s the first analyzer to slot in, but it won’t be the last. When pillar-correlation scanners come online (the ones I teased at the end of the news post), they’ll plug in the same way.
I’m probably renaming the daily_range:{ticker} feed to enhanced_quote. I’m not sure WTF I was thinking when I named it.
Quote Widgets Revamp
The motivation here was simple: I wanted one widget that showed session highs/lows plus all the stuff I was tab-hopping for — company info, recent splits, SEC filings, and ticker events (e.g., like when Facebook (FB) became Meta Platforms (META)). The architecture is straightforward: DRA passes quote data through over WebSocket; the widget pulls supplemental data via REST.
Easy on paper. EQv1 and EQv2 were disasters anyway. Both hit a py4web REST API with the Widget Data Cache (WDC) caching, and — technically speaking — slower than shit. Deprecated. We don’t talk about them.
The lesson: a cache only earns its keep when the upstream is slow or rate-limited. Mine isn’t either. Unlimited API calls, fast providers — every millisecond of cache lookup was pure overhead, plus a staleness bug waiting to happen. Complexity with no tangible payoff. EQv3 and EQv4 ditch the py4web middleman entirely and consume directly from Massive.com and Finlight. Async. No caching. Way faster.
Two widgets, both fed by DRA for quote data (WebSocket) and supplemental data via REST:
Quote Widget (EQv3)
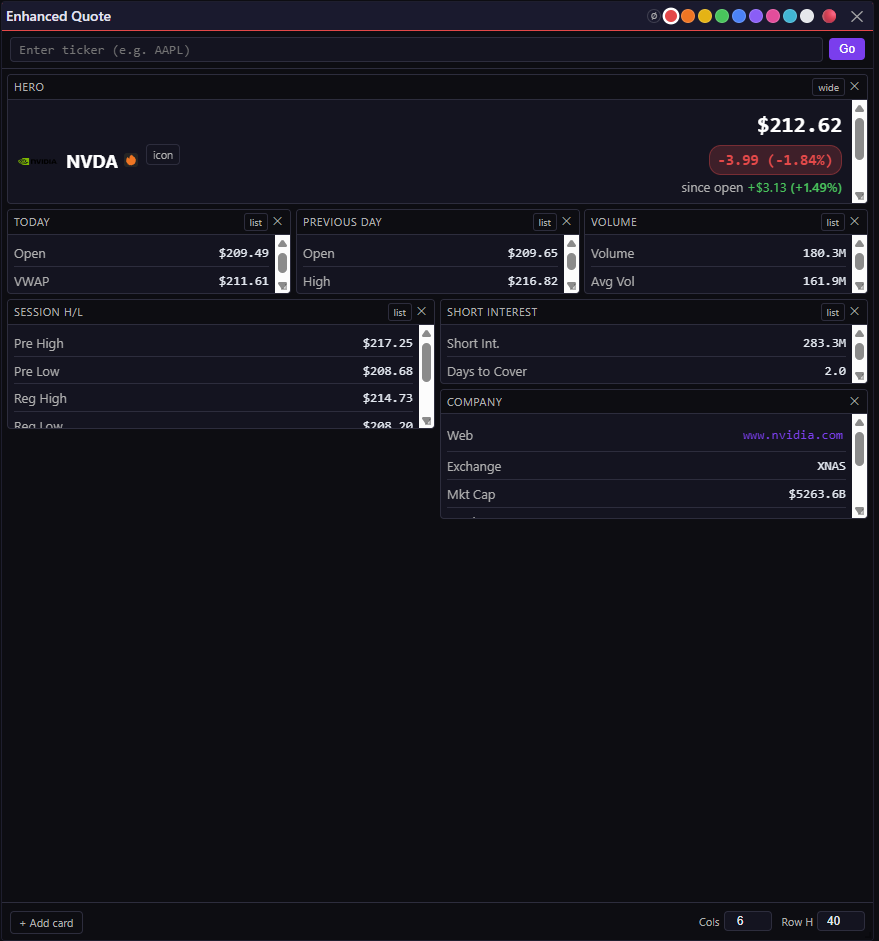
This replaces the old quote widget, which was renamed to “Mini Quote”. This widget uses a column layout with the following cards: Hero, Today, Previous Day, Volume, Session H/L, Short Interest, Company. Customization options include: show, hide, reorder, pick a single-column, two-column, or wide layout.
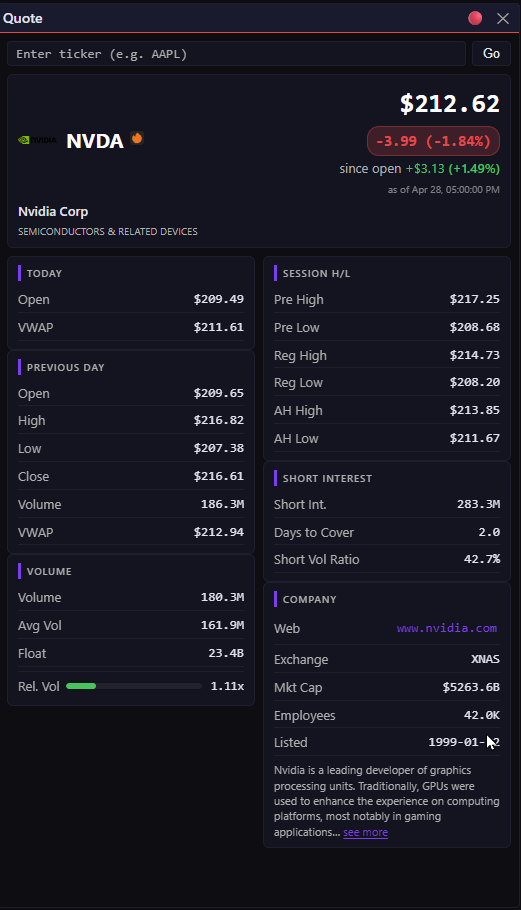
EQv3 out of the box. Column layout, sensible defaults, minimal knobs. “Minimal” is the feature here — I wanted something I could drop on a dashboard without thinking.
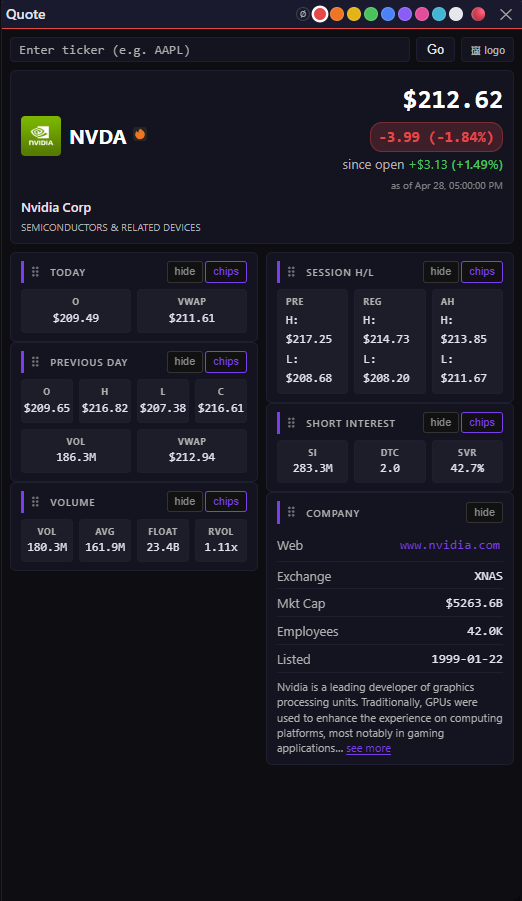
Same widget, every default flipped: icon over logo, chips over lists. Hero card is the only one you can’t hide — everything else is fair game.
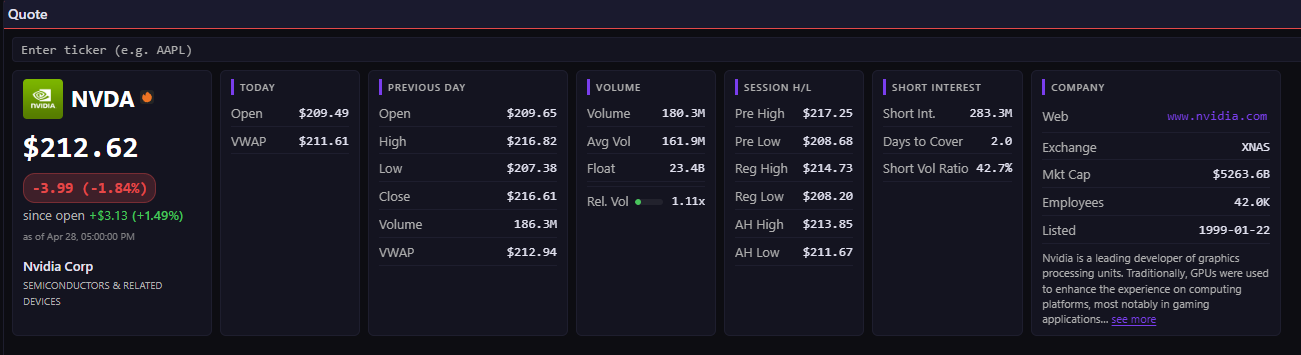
Wide mode. Same cards laid out horizontally — handy on ultra-wide monitors where vertical space is the scarce resource.
Enhanced Quote widget (EQv4)
This is my preferred quote widget. It is highly customizable because it uses a grid layout. It has all the EQv3 cards plus SEC EDGAR Index, Stock Splits, Ticker Events, and Company News. (EQv4 calls Finlight directly for the Company News card — it doesn’t go through the Widget Data Service like the standalone Company News widget does.)
EQv4 out of the box. Yeah, I know. This is the price you pay for a grid layout — flexibility on one end, “WTF am I looking at” on the other. Stick with me.
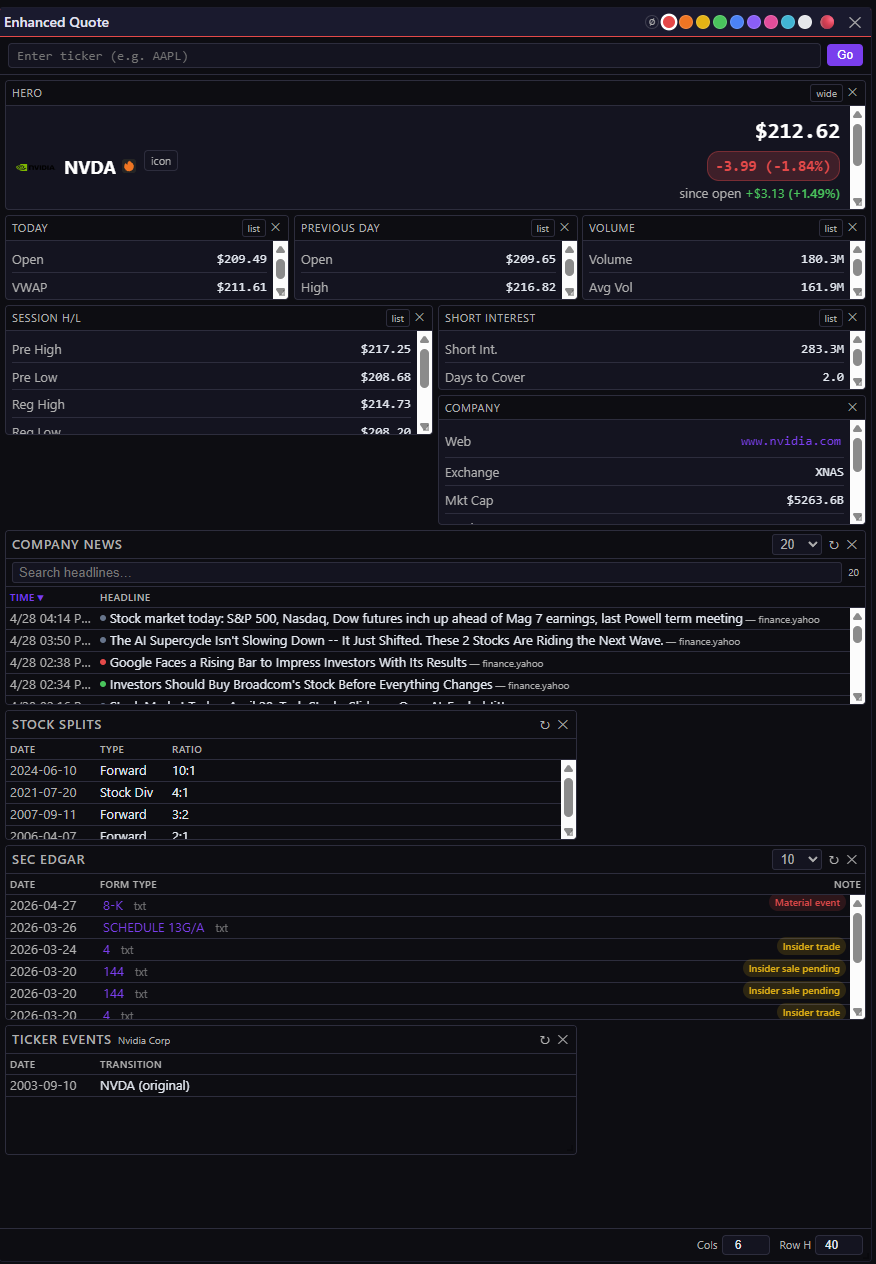
Same unusable default, now with the four new cards added: Company News, Stock Splits, SEC EDGAR, and Ticker Events. Still a mess. Customization comes next.
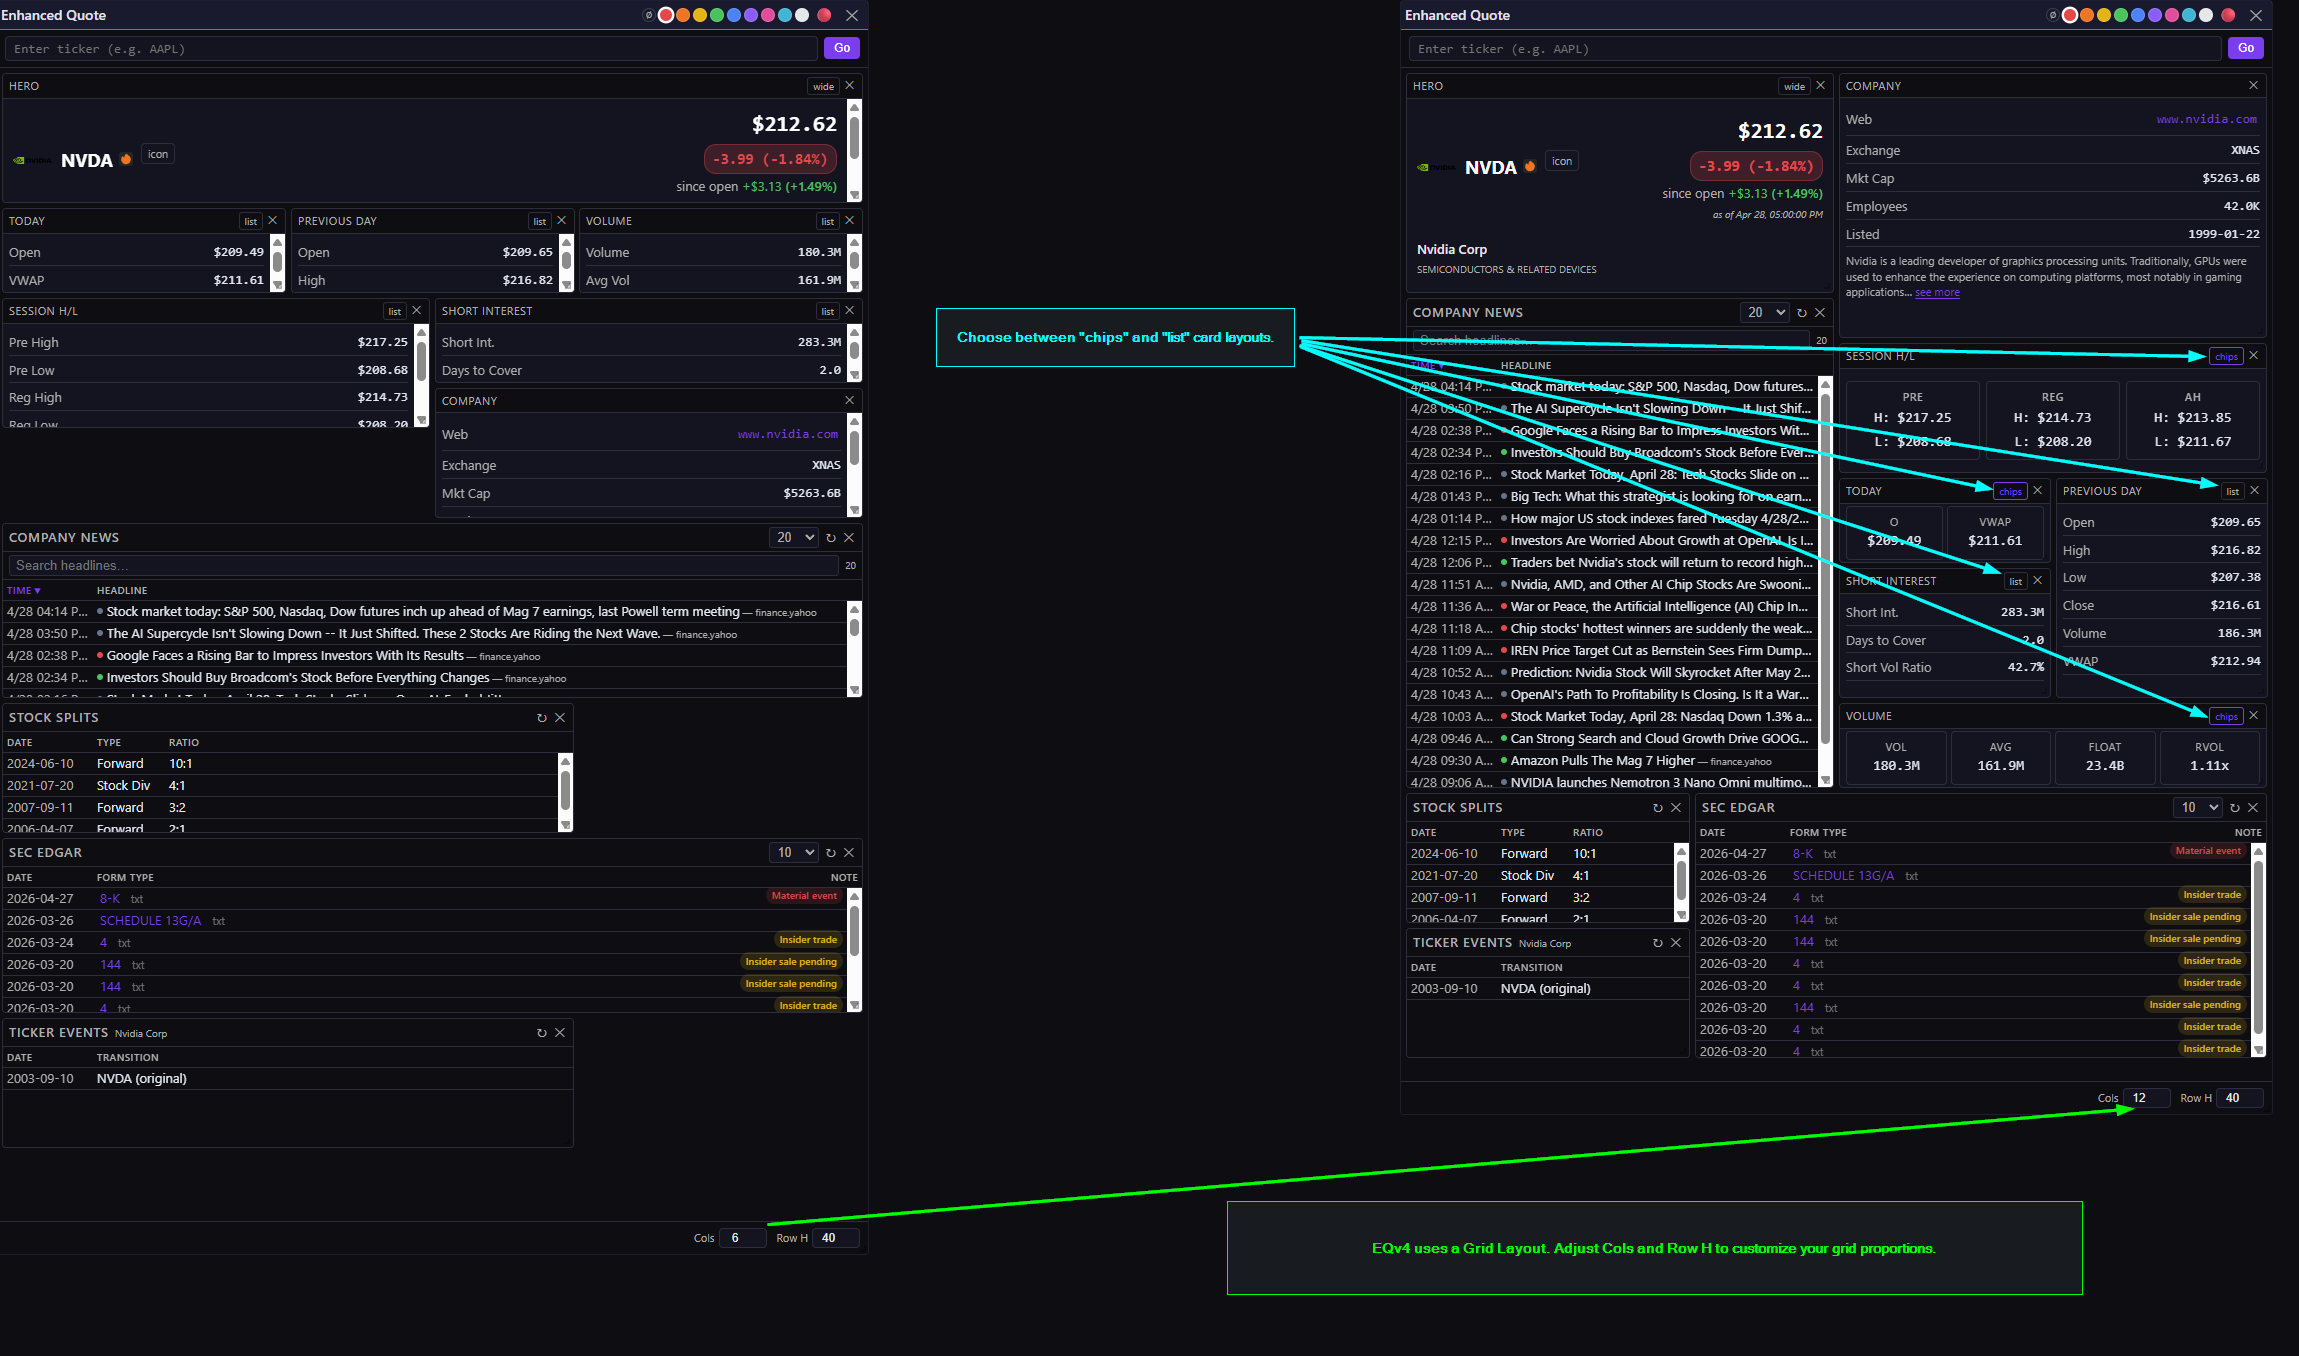
Edit mode. Drag cards anywhere on the grid, dial in column count and row height, swap chips for lists. The unusable default from the last two screenshots becomes whatever you need.
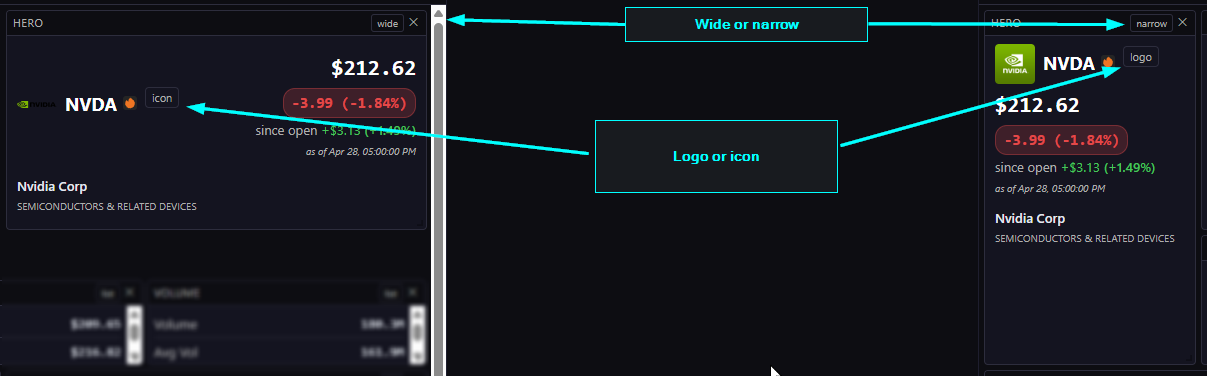
The Hero card has its own knobs. Because of course it does.
Five different EQv4 layouts, same underlying widget. Pick your poison: scanner-view, news-heavy, chart-companion, whatever fits the dashboard slot.
SEC EDGAR Index, Stock Splits, and Ticker Events cards
I trade on technicals — but a 200% morning gap doesn’t matter if the company’s about to dump shares on you. Is this a company that chronically reverse splits and/or dilutes shareholder value? Do they have any active shelf registrations? Is this a notoriously bad stock that has recently changed tickers? These cards help answer all these questions without opening another browser tab.
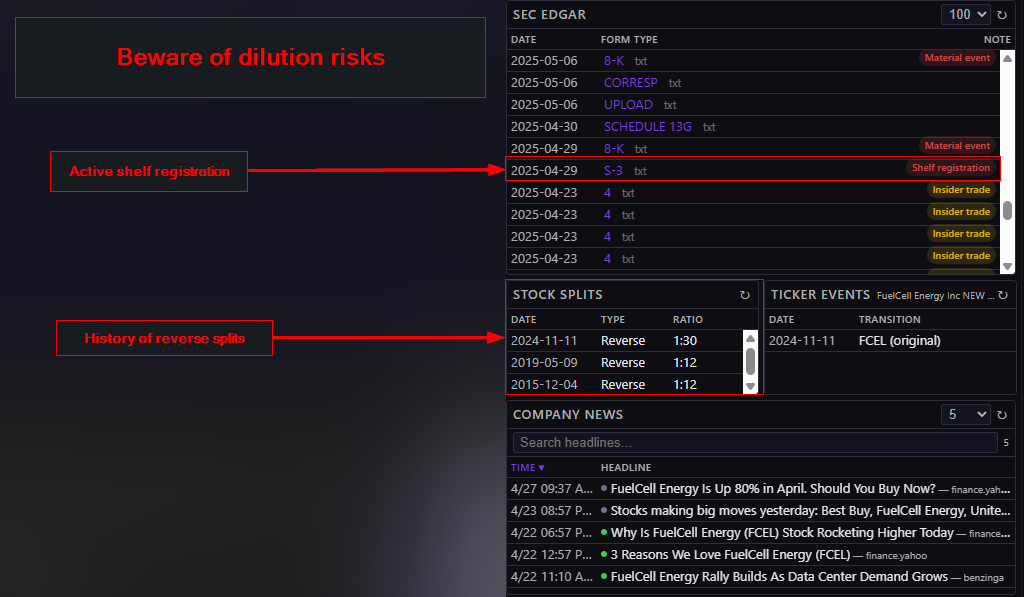
Beware of dilution risks! Companies with active shelf registrations and a history of financial troubles often sell shares on the open market after a big move up. I’m using FCEL as an example but I’m not saying FCEL is going through financial hardships or that they are going to sell shares. I’m saying that they can so, take that into consideration if you’re trading a stock with active shelf registrations or other filings that present a dilution risk.
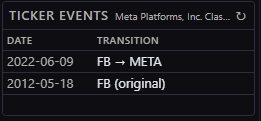
Remember when Mark renamed the company from Facebook (FB) to Meta Platforms (META) because of the metaverse? How’d that turn out? Oh. Yeah. I wonder if he’ll rename the company again now that AI is the big bet…
Mini Quote (the OG)
The original “Quote” widget — the dumb one that only reads the symbol data cache — got renamed to Mini Quote. Same widget, more honest name.
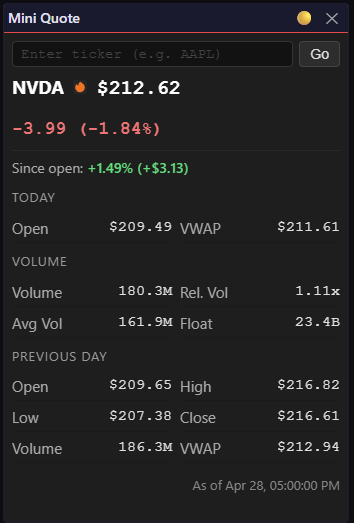
The artist formerly known as “Quote.” Did its job in the early days. These days it lives in the widget library, gathering dust.
EQv4 Company News Card vs Company News Widget
The Company News Widget gets news that is cached in the WDC after being processed by the Finlight Data Processor (FDP). In addition to caching articles that are tagged by Finlight, The FDP searches the title and summary for stock tickers and adds them to the Company News feed. In the case of the MYSE surge on 4/16/2026, Finlight didn’t tag the news article about their rebranding to Myseum.AI. However, the FDP caught it and added it to the Company News feed.
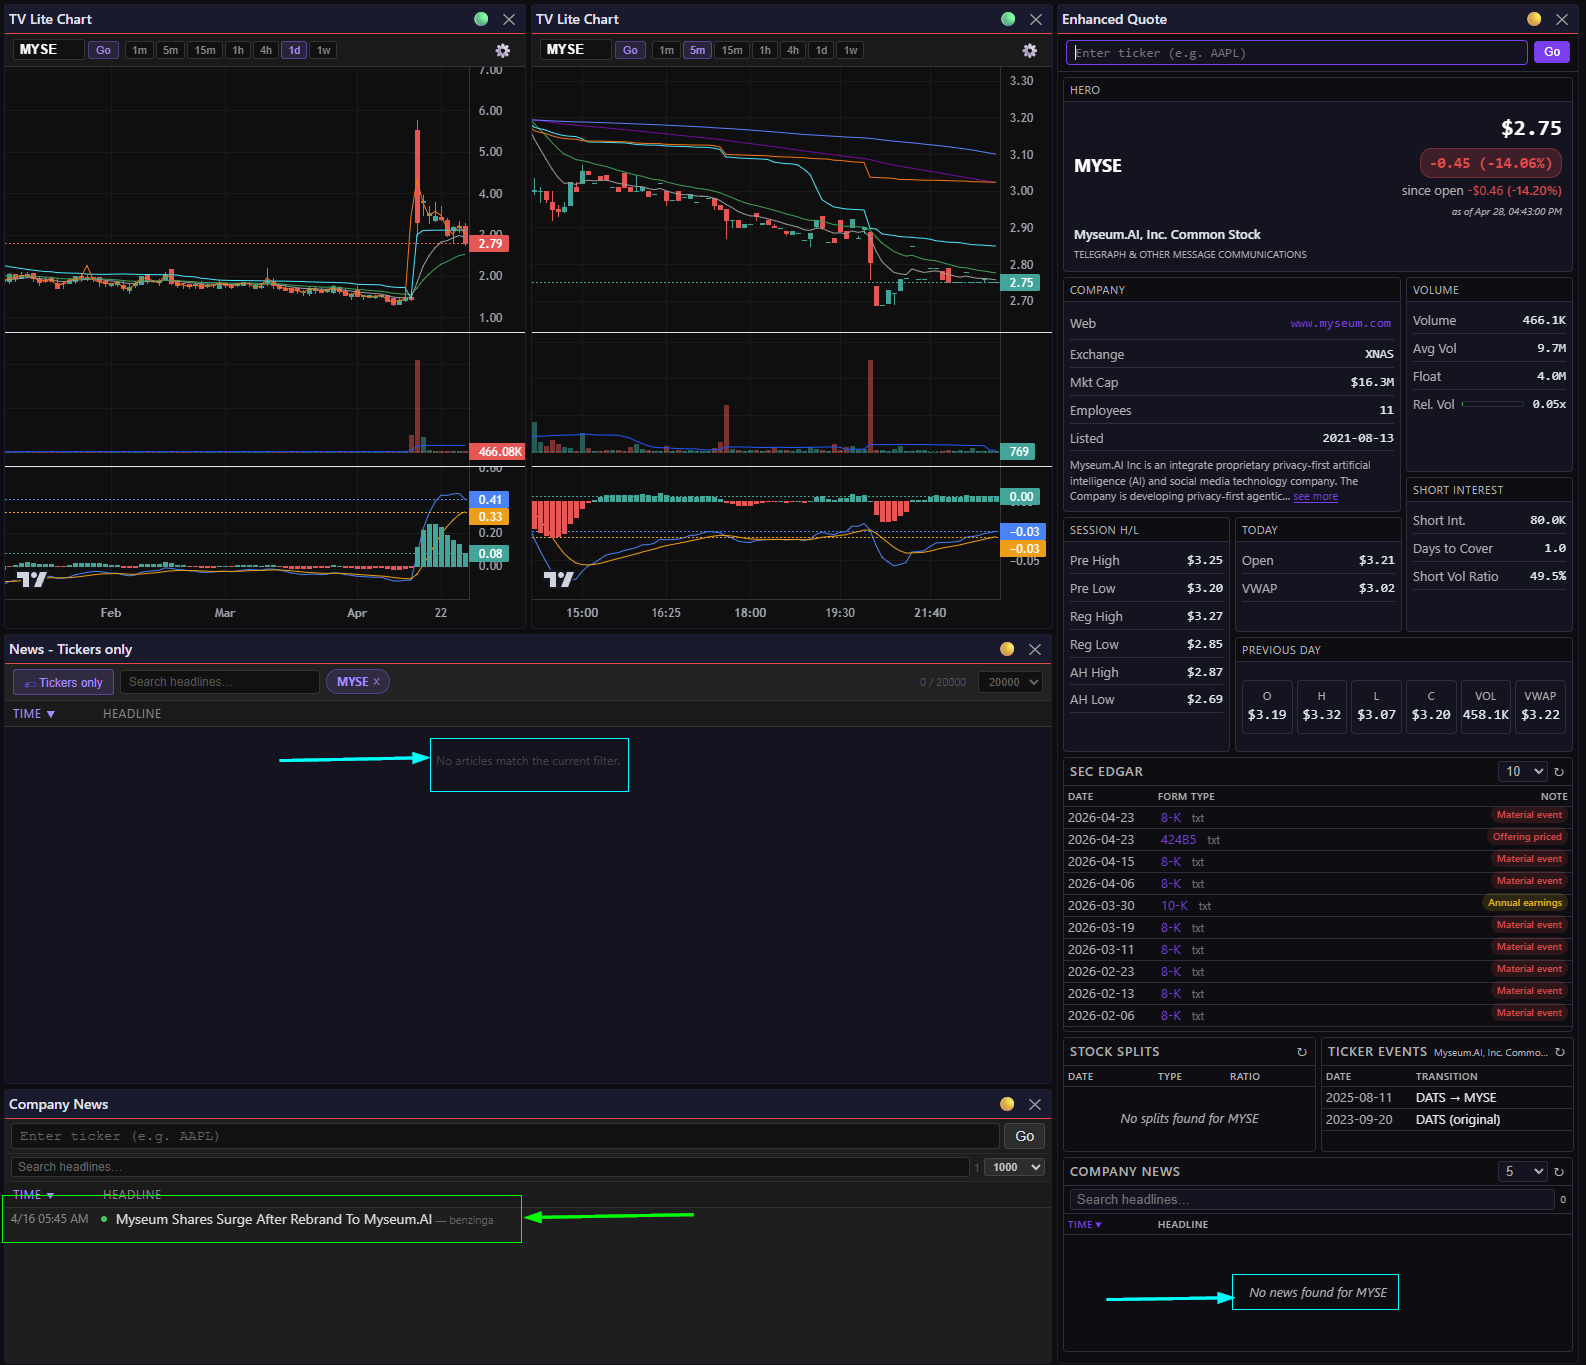
Three widgets, same ticker, same moment. Only the Company News feed caught the Myseum.AI rebrand article — the Card and the News Feed were both blind to it. This is exactly the kind of gap I’m trying to close in Wave 3.
Range Alerts Widget
HOD/LOD alerts are noisy. Like, Saturn V rocket launch noisy. So this widget leans heavily on filters to surface only the tickers matching your criteria, and those settings persist with your layout. Drop it in HOD or LOD mode, wire it to the event bus, and clicking a row lights up that ticker across every linked widget on the dashboard. Flip on “filter” mode and the Range Alerts widget itself collapses down to just that ticker too — which makes it easy to spot when a ticker has successively breached previous HOD or LOD thresholds.
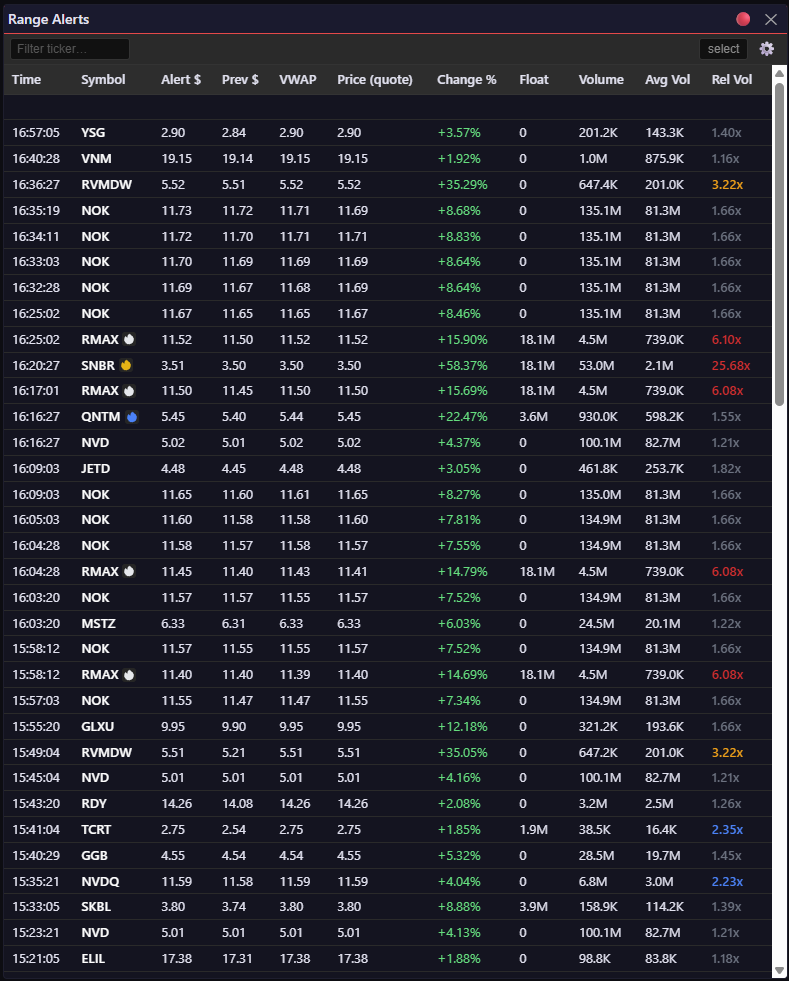
Range Alerts in normal mode. New HOD/LOD breaches stream in live; click a row and the rest of the dashboard pivots to that ticker.
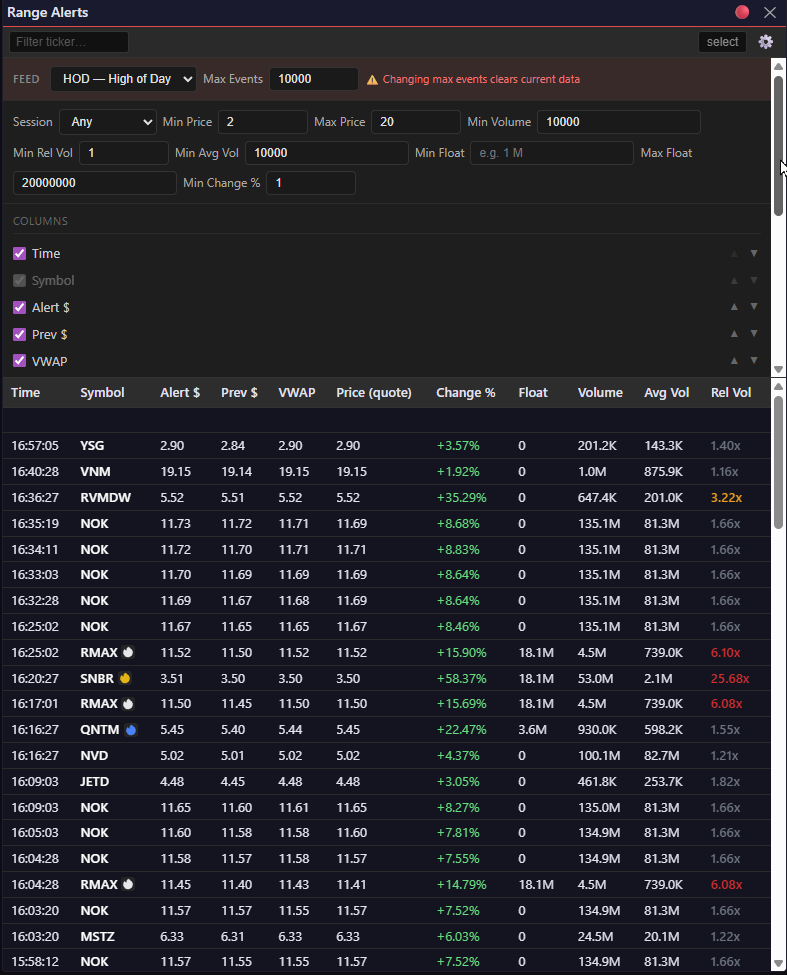
My day-trading filter settings: $2–$20 price, 20M max float, 1× relative volume, 1% minimum change. Without these, the feed is unreadable. With them, most alerts are at least worth the click to look at the charts.
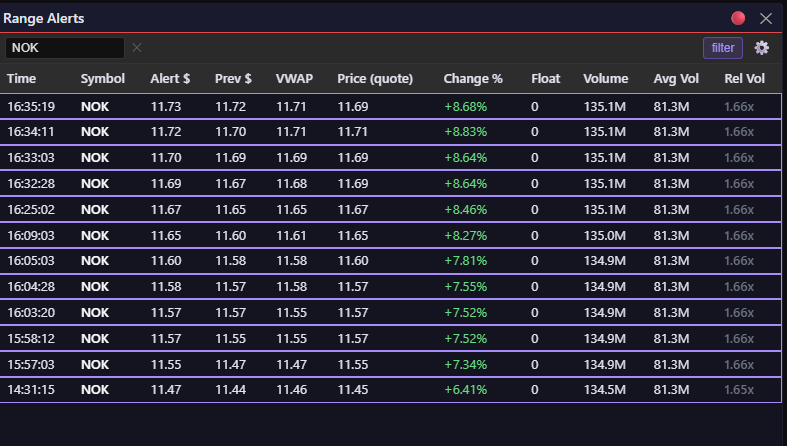
Filter mode locked onto NOK. Now I can watch successive HOD breaches on a single ticker without the rest of the market screaming for attention. This is how I spot momentum building in real time.
The Flame System I introduced last month is going to do a lot of work here once Wave 3 lands. A red flame on a ticker that just breached HOD? That’s the signal I’ve been trying to build toward for six months.
Charts (Finally)
I’m a momentum trader. My screening loop is brutal: look at the daily and 5-minute charts, check moving averages, VWAP, volume, average volume, and MACD. Decide in five seconds whether a ticker deserves more attention. The old workflow — manually typing tickers into TradingView dozens of times a morning — was wrecking my flow.
So Wave 2 adds basic charting. Candlesticks only. No trend lines, no drawings. This is a triage tool, not a TradingView replacement.
There are two implementations with feature parity for now:
- Candlestick Chart — Apache ECharts
- TV Lite Chart — TradingView Lightweight Charts
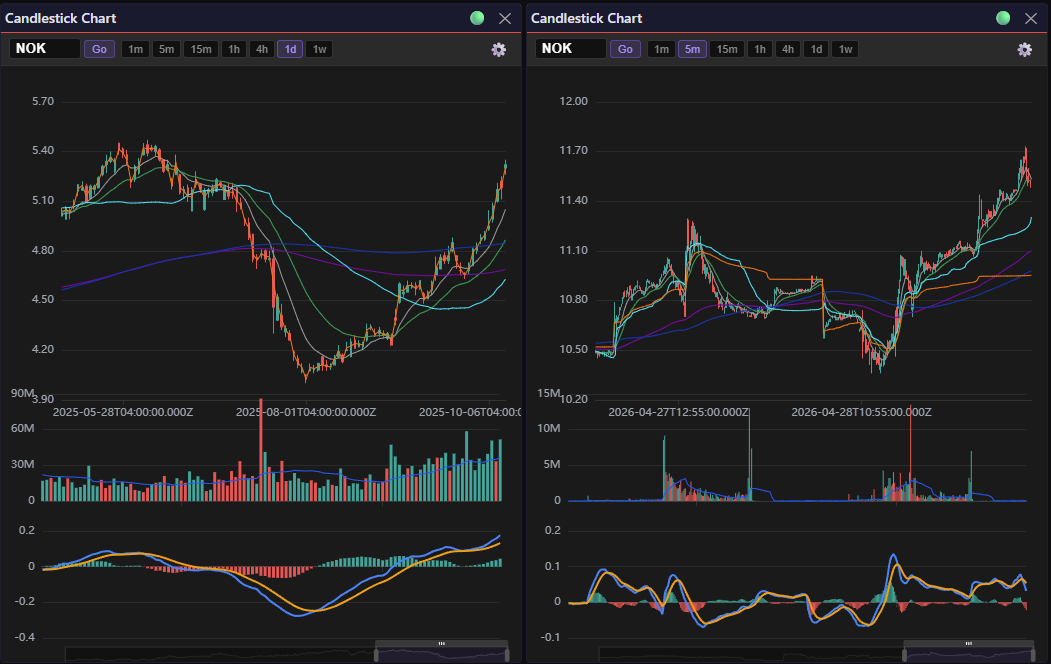
Apache ECharts implementation. Daily chart on left, 5-minute on the right — both with my standard indicator stack: 9/21/200 EMA, 50 VWMA, 200 SMA, VWAP, volume, and MACD.
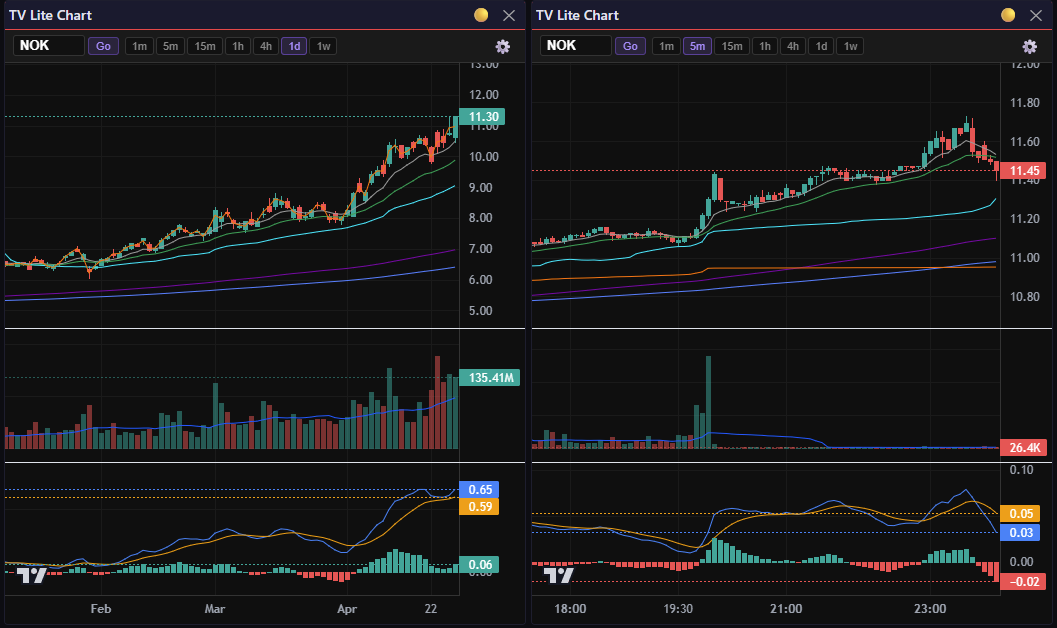
Same indicators, TradingView Lightweight Charts. Feature parity for now. Any custom indicator work will have to live in ECharts.
Both ship the same indicators: 3 EMAs, 2 SMAs, 2 VWMAs, VWAP, volume + average volume, and MACD. The default moving average setup mirrors what I run on 80% of my own charts: 9 EMA, 21 EMA, 50 VWMA, 200 EMA, 200 SMA. (When I’m swing trading, I swap in the 50 SMA and 9 VWMA on a couple of charts.)
Why two chart libraries? Because TradingView Lightweight Charts don’t support custom indicators — that’s a paid-tier feature, and PineScript only runs on TradingView’s platform anyway. ECharts gives me a path to eventually port my Momentum Indicators PineScript to something I actually own. Whether that hill is worth dying on is to be determined but I’m certainly going to try.
What’s Next
Wave 2 is about finding stocks worth trading. Iteration 8 just shipped, Iteration 9 is in flight, and by the time it wraps we’ll be there.
Wave 3 is about identifying buy and sell signals — correlating price action with news catalysts and surfacing those signals in real-time.
Wave 2 gives me eyes. Wave 3 gives me a trigger. Wave 4 gives the system a trigger finger.