What I Built After Quitting Amazon (Spoiler: It’s a Stock Scanner) — Part 5
Wave 1 Complete: Bugs, Bottlenecks, and Breaking 1,000 msg/s
📖 Stock Scanner Series:
- Part 1: Why I Built It
- Part 2: How to Run It
- Part 3: How to Deploy It
- Part 4: Evolution from Prototype to Production
- Part 5: Bugs, Bottlenecks, and Breaking 1,000 msg/s (you are here)
Ten days. Nineteen versions. One bottleneck that had been hiding since day one.
When I last checked in, the Kuhl-Haus Market Data Platform was functional but fragile — OpenTelemetry was wired up, the data plane was flowing, and I was cautiously optimistic. Since then, the platform went from “it works on my machine” to processing 1,490 messages per second at market close without breaking a sweat. Test coverage went from 35% to 100% on the GitHub badge. And the whole thing got a proper documentation site, because apparently I’m building a real open-source project now.
Let’s talk about how we got here — starting with the bug that almost made me mass-delete my OTEL code.
The MDQ Bottleneck: A Technical Detective Story
The Crime Scene
Right after wiring up OpenTelemetry context propagation, the Market Data Listener started doing something… weird.
Below about 200 messages per second, everything was fine. Normal. Happy. But push the volume higher and the RabbitMQ publish pipeline would just freeze. Not crash — freeze. The MDL stayed connected upstream, happily receiving data from Massive. It just stopped publishing it anywhere useful.
My first instinct? Blame OTEL. I’d just added trace context propagation to the message headers. The timing was suspicious. Of course it was the new code.
Spoiler: it wasn’t.
Following the Evidence
First thing I did was open Issue #3 to track the problem — because debugging without a paper trail is just vibes. First action item: mitigate. That meant reverting the distributed tracing changes in MDL (v0.2.14). Stabilize the patient, then figure out what’s actually wrong.
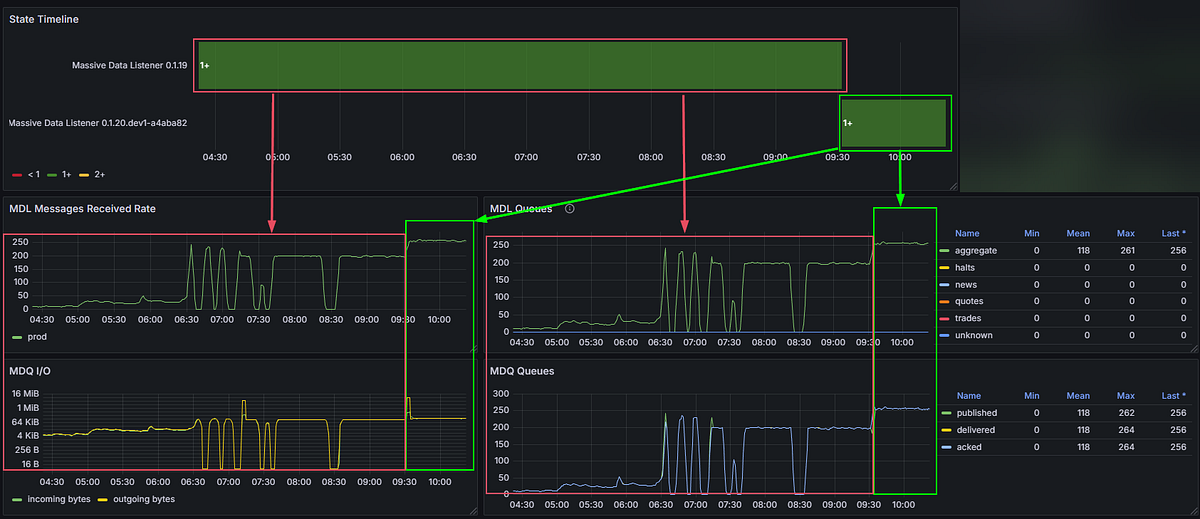
Clear evidence of a bottleneck — observability merely pushes it past its breaking point.
If you’re squinting at version numbers in the dashboard screenshots and they don’t match the ones in this article — you’re not losing it. As I mentioned in Part 4, kuhl-haus-mdp (core library) and kuhl-haus-mdp-servers (deployment) are separate repos with separate version tracks. This article references kuhl-haus-mdp versions (change log). The dashboards show kuhl-haus-mdp-servers versions (version history).
Then the monitoring told the story. The throughput graph had a flat top. Not a gradual degradation, not random drops — a clean ceiling at approximately 270 msg/s. That pattern is a dead giveaway. Something structural was capping throughput, and it had nothing to do with the network, the broker, or the upstream feed.
Root Cause: Sequential Single-Channel Publishing
Here’s what the publish pipeline looked like:
async def handle_messages(self, msgs: List[WebSocketMessage]):
    for message in msgs:
        await self.fanout_to_queues(message)

async def fanout_to_queues(self, message: WebSocketMessage):
    serialized_message = WebSocketMessageSerde.serialize(message)
One message. One channel. One round-trip. Wait for the broker acknowledgment (~20ms). Repeat.
With publisher confirms enabled and a single AMQP channel shared across six queues, the maximum theoretical throughput was roughly 50 publishes per second per confirm cycle. In practice, the event loop managed to interleave enough work to squeeze out ~271 msg/s — but that was still nowhere near the 1,000+ msg/s I needed during peak market hours. On a local development host (RTT ~1ms), the same code easily exceeded 1,000 msg/s, masking the issue during development and testing.
The OTEL instrumentation didn’t cause this bottleneck. It exposed it. The additional overhead from trace context propagation pushed the pipeline just hard enough to make a latent architectural flaw visible. The bottleneck had been there all along, patiently waiting for enough load to matter.
That’s not a bug in your observability tooling. That’s your observability tooling doing its job.
The Fix
Version 0.2.17, commit caf1ddd. This wasn’t a one-liner.
async def handle_message(self, message: dict) -> None:
    routing_key = message.get("ev", "unknown")
    message_body = self._serialize_message(message)
    await self._publish_message(message_body, routing_key)

async def _publish_message(self, message_body: bytes, routing_key: str) -> None:
    # Pre-build all Message objects before any network I/O
    publish_tasks = []
    for queue_name, channel in self.queue_channels.items():
        msg = Message(
            message_body,
            delivery_mode=DeliveryMode.NOT_PERSISTENT,
        )
        publish_tasks.append(
            channel.default_exchange.publish(msg, routing_key=queue_name)
        )

    # One concurrent burst — no sequential round-trips
    await asyncio.gather(*publish_tasks, return_exceptions=True)
The obvious part: allocate one dedicated AMQP channel per queue — six channels — so publishes to different queues are never serialized at the broker level. Fire them all concurrently with asyncio.gather instead of awaiting each one in a loop.
The less obvious part: asyncio.gather is only fast if the coroutines it’s gathering are ready to go. That meant pre-building all Message objects and resolving queue names before any network I/O begins. Separate the prep from the publish. By the time gather fires, there’s zero computation left — just concurrent network calls.
The cleanup: publisher_confirms became a constructor parameter (default True) for toggling fire-and-forget. Delivery mode switched to NOT_PERSISTENT — ephemeral market data doesn’t need durability. The old fanout_to_queues method was deleted; handle_messages now delegates to _publish_message directly. Shutdown and queue setup were updated to manage per-queue channel lifecycles.
Result: 270 msg/s → ~600 msg/s. More than double, once I stopped asking asyncio to be concurrent and actually gave it the structure to do so.
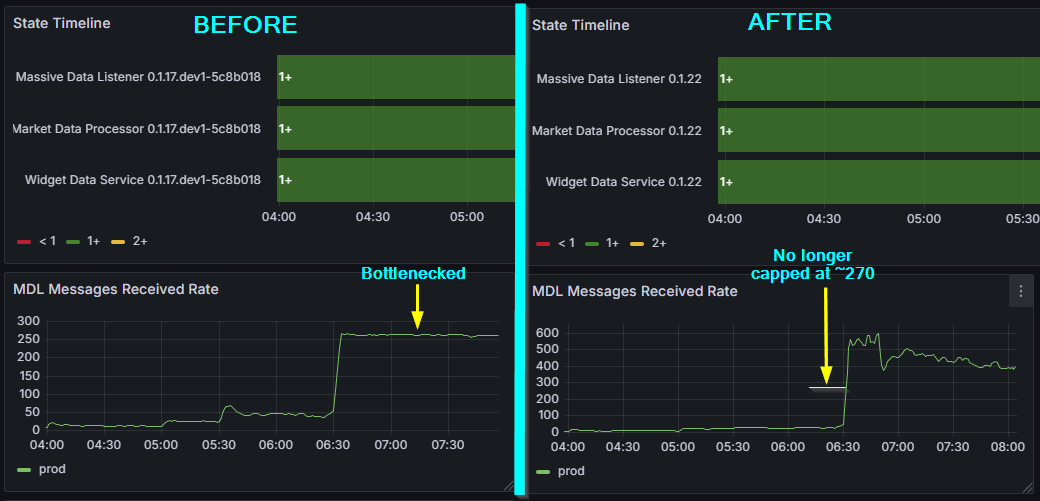
Left: that flat top at ~270 msg/s is the dead giveaway — a structural ceiling, not a load problem. Right: one commit (caf1ddd), concurrent channels, and the ceiling is gone.
The Lesson
Writing async def doesn’t make your I/O concurrent. It makes it possible to be concurrent. You still have to design for it — explicitly, intentionally. An await in a for loop is sequential I/O with extra syntax.
And sometimes the best thing your observability tooling can do is break something that was already broken. You just couldn’t see it yet.
Proving 1,000+ Messages Per Second
With the MDQ bottleneck gone, the natural question was: how far can we push this?
The answer came in layers, and peeling them back was half the fun.
Layer 1: Publisher Confirms (~850 msg/s)
The concurrent channel fix got me to 600, however, further testing showed it bottlenecking around 850 because publisher confirms were still the constraint. Every publish waited for a basic.ack from the broker before the channel was free again. Safe? Yes. Fast? Not fast enough.
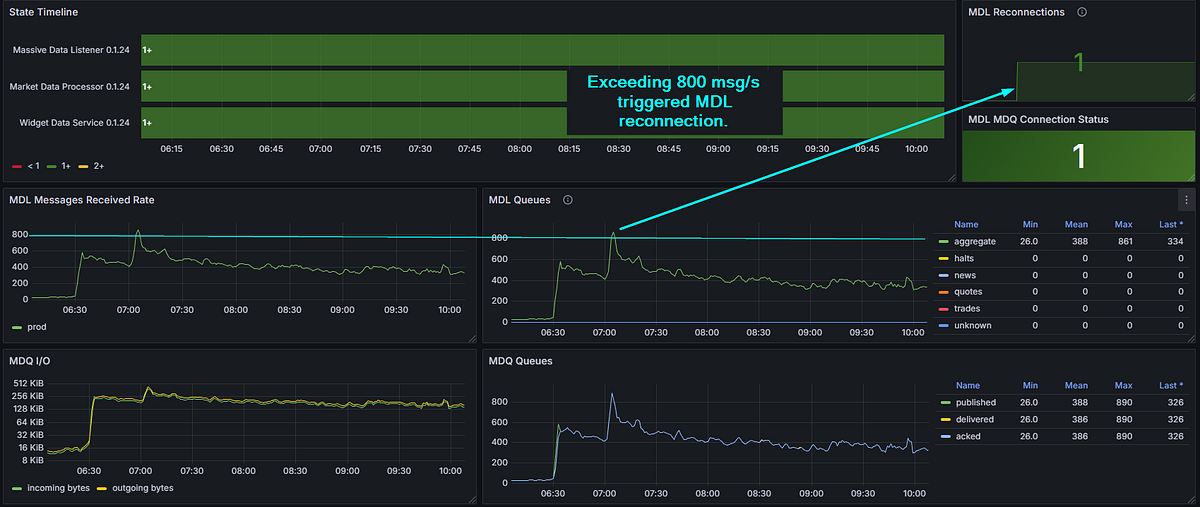
Layer 1: publisher confirms on, ~800 msg/s sustained. Push past that and the MDL reconnects — visible top-right. The ACK wait is now the ceiling.
Layer 2: Fire and Forget (~2,500 msg/s)
Flipping publisher_confirms=False changed the game entirely. Without ACK waits, publishes become fire-and-forget — the message hits TCP buffers and the code moves on. Peak throughput jumped to approximately 2,500 msg/s before something else became the limiting factor.
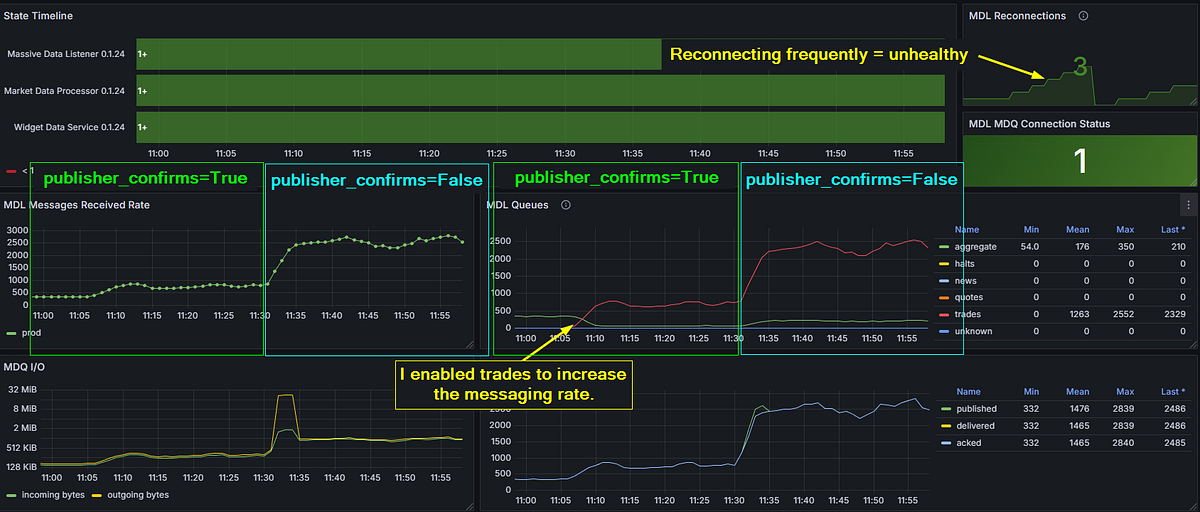
Layer 2: one transition from publisher_confirms=True to False, seen from two angles — received rate on the left, queue throughput on the right. Trades enabled to crank the volume. Fire-and-forget blows past 2,500 msg/s — but three reconnections and an unhealthy MDL say we found the next ceiling, not the final answer.
For a market data platform where the next tick makes the last one obsolete, this is an acceptable tradeoff. I’m not processing bank transfers. I’m distributing prices that have a shelf life measured in milliseconds.
Layer 3: Right-Sizing the Feed
The trades feed was the highest-volume data source by a wide margin — and, like I said in my last post, it wasn’t needed for any of my current analysis use cases. Once I’d proven the platform could handle the load, I disabled it. No point burning resources on data nobody’s consuming.
The Money Shot: 1,490 msg/s at Market Close
With the remaining feed — aggregates — running against real market conditions, the platform hit 1,490 msg/s at market close. That’s peak load, during one of the most volatile parts of the trading day, and the platform handled it without so much as a hiccup.
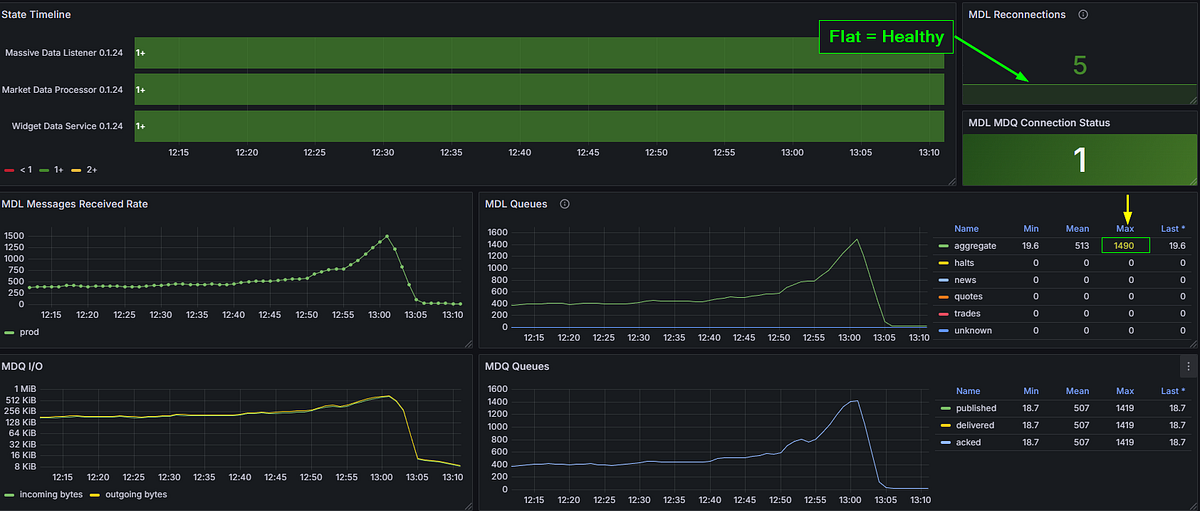
1,490 msg/s at market close. Healthy connection. Five reconnections since the service started — all from earlier testing. That number highlighted top-right? The one with the yellow arrow pointing at it. That’s Wave 1, answered.
This is the milestone the whole series has been building toward. Wave 1 was about answering one question: can this architecture handle real market data at production speeds?
Yes. Yes it can.
Read the Docs: Looking Like a Real Project
Somewhere between debugging bottlenecks and chasing throughput numbers, the platform got a proper documentation site: kuhl-haus-mdp.readthedocs.io.
If you saw the docs two weeks ago, there wasn’t much to see. A README and some wishful thinking. Now there’s a full Sphinx site with:
- Architecture diagrams — PlantUML for the Data Plane, Control Plane, Observability layer, and Deployment Model. Not boxes-and-arrows napkin sketches. Real diagrams that actually reflect the codebase.
- Auto-generated API reference — via Sphinx
automoduledirectives, so the docs stay in sync with the code without manual intervention. - Security policy — dual-format because life is complicated. The
.rstfile is the source of truth for Sphinx; a.mdstub lives in the repo root so GitHub’s Security tab picks it up. One policy, two audiences. - Modern packaging — this was the push to finally kill
setup.py,setup.cfg, andtox.iniin favor of a singlepyproject.tomlmanaged by PDM. PEP 517/518 compliance. Clean, modern, no legacy cruft.
None of this is glamorous work. But if you want anyone else to take your project seriously — or even future-you six months from now — documentation is the difference between “open source project” and “code dump on GitHub.”
The Supporting Cast
A lot happened in 19 versions that doesn’t warrant its own section but still matters. Here’s the highlight reel:
Structured Logging (v0.2.8): Switched to python-json-logger and enforced proper getLogger(__name__) hygiene across every module. Boring? Yes. Essential for debugging in a distributed system? Also yes.
New Analyzers (v0.2.15–v0.2.16): TopTradesAnalyzer — Redis-backed, sliding window, cluster-throttled. MassiveDataAnalyzer refactored to fully async with OTEL instrumentation. The analysis pipeline is starting to look like a real thing.
Market Status Handling (v0.2.19): MarketStatusValue enum so the MDL knows when the market is open, closed, or in extended hours. Sounds trivial. Prevents an entire class of “why isn’t anything happening” false alarms.
MDL Auto-Restart (v0.2.25): Property setters on feed, market, and subscriptions that trigger asyncio.create_task(self.restart()) automatically. Change a configuration value, get a restart. No manual intervention needed.
Test Coverage: From 35% to the Badge That Says 100%
On February 9th — the date of my last post — code coverage stood at 35.74%. Today the GitHub badge reads 100%. That didn’t happen by accident, and it didn’t happen all at once.
Phase 1: Get the Needle Moving
The first pass was simple: establish a minimum of 85% coverage at the module level. No heroics, no edge cases, no agonizing over branch coverage in error handlers. Just write the obvious tests, cover the obvious paths, and get the number to a place where it’s no longer embarrassing.
35.74% → 97%. Fast, relatively painless, and immediately useful. You learn a lot about your own code when you’re forced to write tests for all of it.
Phase 2: Test Coverage Review & Improvement Plan
Phase 2 was different. I opened Issue #4 — a systematic, module-by-module review with one goal: push from competent coverage to comprehensive coverage. 398 tests. 1,853 statements. 5 missed. Every test follows AAA format (Arrange, Act, Assert) with consistent sut naming.
97% → 99%+. And this is where things got interesting.
The Bug That Tests Found
During the Phase 2 review of the Websocket Data Service, I discovered that every pmessage wildcard subscription was being silently dropped. The WDS was subscribing to patterns and then… quietly receiving nothing. No errors. No warnings. Just silence.
I didn’t find this bug by hunting for bugs. I found it by writing thorough tests for code I assumed was working. That’s the whole point of Phase 2. Phase 1 buys you credibility. Phase 2 buys you correctness.
Looking Forward: The Four Waves
This post wraps up Wave 1. It’s a starting gun, not a finish line.
I’ve been thinking about the platform’s roadmap in terms of a SIGINT fire-control analogy — four waves, each building on the last:
- Wave 1: Broad Search — Scan the market for stocks in play. Ingest data, distribute it, prove the architecture can handle production load. Done.
- Wave 2: Target Acquisition — Stock selection by strategy. Which instruments deserve attention based on volume, volatility, or pattern recognition?
- Wave 3: Target Lock — Identify buy/sell signals. The analysis pipeline generates actionable intelligence.
- Wave 4: Fire — Execute trades. Paper trading first, then live API integration if the signals prove out.
The infrastructure work is done. The boring-but-essential foundation — logging, observability, testing, documentation, performance — is solid. Now the interesting stuff starts.
Wave 2 is next. Time to find some targets.
All code is open source at kuhl-haus/kuhl-haus-mdp. Star it, fork it, or tell me what I’m doing wrong.