What I Built After Quitting Amazon (Spoiler: It’s a Stock Scanner) — Part 3
Deployment and infrastructure — Production deployment strategies and cost optimization techniques
📖 Stock Scanner Series:
- Part 1: Why I Built It
- Part 2: How to Run It
- Part 3: How to Deploy It (you are here)
- Part 4: Evolution from Prototype to Production
- Part 5: Bugs, Bottlenecks, and Breaking 1,000 msg/s
Introduction
If you’ve been following along with this series, you know the journey so far: I quit Amazon after a decade, dove into day trading, realized I needed better tools, and built a real-time stock scanner from scratch. In Part 2, we got it running on your local machine using Docker Compose — a great way to kick the tires and see if it fits your needs.
But here’s the thing: running it on your laptop is fun. Running it in production is a whole different game.
Your laptop sleeps. Your PC reboots. You want to check your scanner from your phone while you’re out, but localhost:8000 doesn’t work from Starbucks. And let’s be honest — if you’re serious about day trading, you need your scanner up at 4:00 AM Eastern, not whenever you remember to start Docker.
That’s where Part 3 comes in.
What this post covers
Part 2 bombed. You wanted the story, not a glorified README. The engagement numbers don’t lie.
So here’s the deal: I’ve open-sourced my entire production CI/CD stack — the actual Ansible playbooks, GoCD pipeline configs, and deployment scripts running my Market Data Platform in production. Not toy examples. The real deal.
But I’m not going to bore you with another README walkthrough. The docs exist — you don’t need me to read them to you.
Instead, I spun up a fresh Kubernetes cluster on Docker Desktop and deployed the whole stack from scratch. What you’re getting here are the moments that matter: the configuration decisions, the differences between deployment environments, and the hard-won insights that never make it into official documentation.
Think of this as the director’s commentary track for your deployment.
From Docker Compose to Production
Docker Compose is perfect for local development. One command, everything runs, you’re done.
Production requires thinking about:
- High availability: Auto-restart crashed components
- Scalability: Handle market open when thousands of stocks update every second
- Security: No hardcoded credentials
- Reliability: Market open waits for no one
- Maintainability: Patches and updates happen
What You’ll See
By the end of this post, you’ll watch me:
- Deploy the entire Market Data Platform to Kubernetes using Ansible
- Set up networking, storage, ingress, and TLS certificates
- Validate end-to-end functionality
We’ll walk through the deployment playbooks step-by-step, and I’ll show you the exact modifications I made to go from example configuration to fully-functioning production setup.
Fair warning: This isn’t click-and-deploy. You’ll wrangle Ansible, Kubernetes, and YAML files. But you’ll also get a real CD foundation that works with any automation tool. I’m running the scripts manually here, but anything that can clone a repo and run bash scripts will work.
Let’s deploy something.
Prerequisites
You’ll need Kubernetes (v1.32+) and Ansible (2.19+). I’m using Docker Desktop’s built-in Kubernetes because it’s dead simple for local testing, but these manifests work on any cluster — EKS, GKE, on-prem, whatever.
One critical note: Don’t deploy this to a public cloud and expose it to the internet. The security model assumes you’re behind a firewall. If you’re running this in AWS or GCP, keep it in a private subnet or you’re gonna have a bad time.
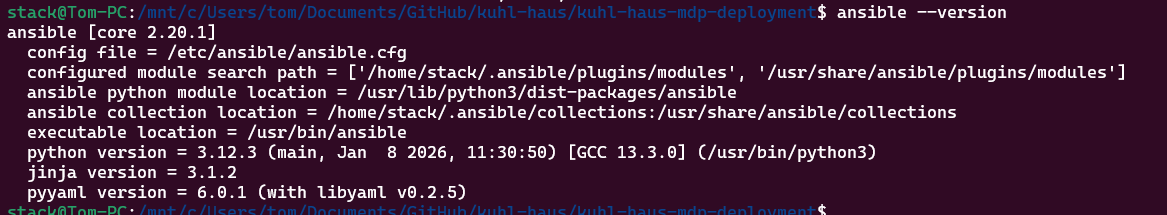
SCREENSHOT: Tool versions verification
Initial Setup
I’m running this on WSL2 (Windows 11, Ubuntu). My shell user is stack - same username as my production Ansible account. This matters because Ansible uses your local username for remote connections by default. If yours is different, you’ll need to override it in the inventory file or you’ll spend 20 minutes wondering why SSH keeps failing.
Step 1: Clone the Repositories
Three repos to grab:
cd /mnt/c/Users/tom/Documents/GitHub
mkdir kuhl-haus
cd ./kuhl-haus
gh repo clone kuhl-haus/kuhl-haus-mdp-servers
gh repo clone kuhl-haus/kuhl-haus-mdp-app
gh repo clone kuhl-haus/kuhl-haus-mdp-deployment
The fourth repo (kuhl-haus-mdp) is the core library - you don’t need it for deployment, it’s a dependency that gets pulled in automatically.
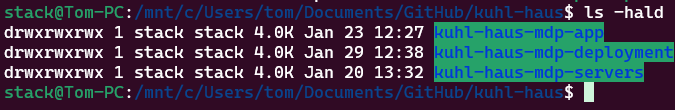
SCREENSHOT: terminal showing directory structure
Step 2: Configure Ansible Vault
Here’s where people usually screw up: you need to create the vault file before running any playbooks.
The vault holds your API keys, passwords, and other secrets. The example shows you the structure, but don’t just copy-paste — you need real credentials.
Create a vault at ansible/group_vars/secrets.yml, which is .gitignored, so your secrets stay local.
ansible-vault create ansible/group_vars/secrets.yml
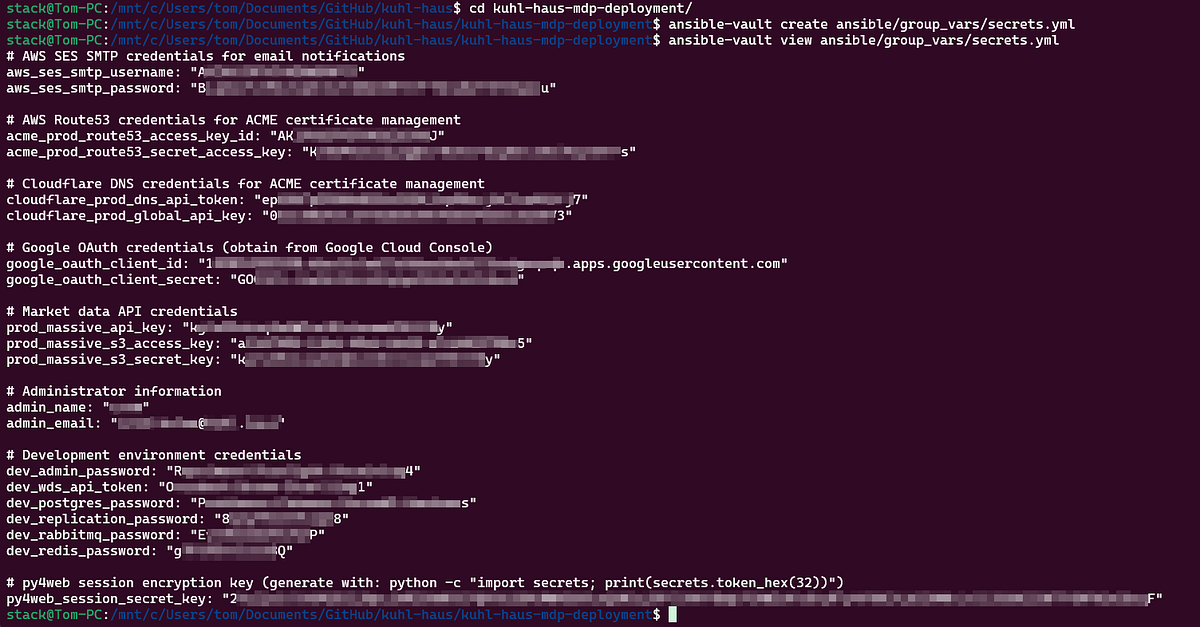
SCREENSHOT: Vault configuration example (redacted sensitive data)
Step 3: Environment Variables
Three variables matter:
APP_ENV- This is the name of your inventory folder underansible/inventories/. I useddev(which is .gitignored, so your dev inventory stays local). Production would beprod, staging would bestaging, etc.BASE_WORKING_DIR- Where you cloned the repos- Domain names for your services
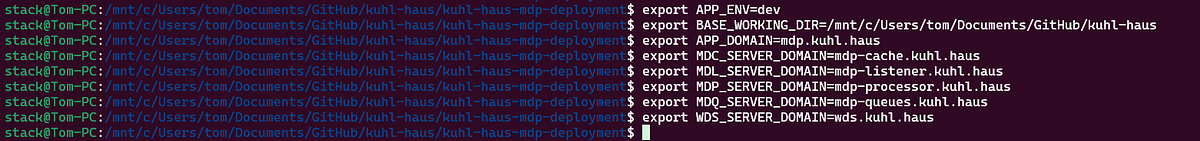
SCREENSHOT: Set environment variables
Step 4: Inventory
Copy the example inventory and edit it:
cp -af ansible/inventories/example/ ansible/inventories/dev/
vim ansible/inventories/dev/hosts.yml
The example has placeholder domains. Change them to yours. If you’re setting up TLS, this is where you configure your ACME/Let’s Encrypt details.
Why this matters: Kubernetes ingress routes traffic based on hostnames. Get these wrong and you’ll deploy successfully but won’t be able to access anything.
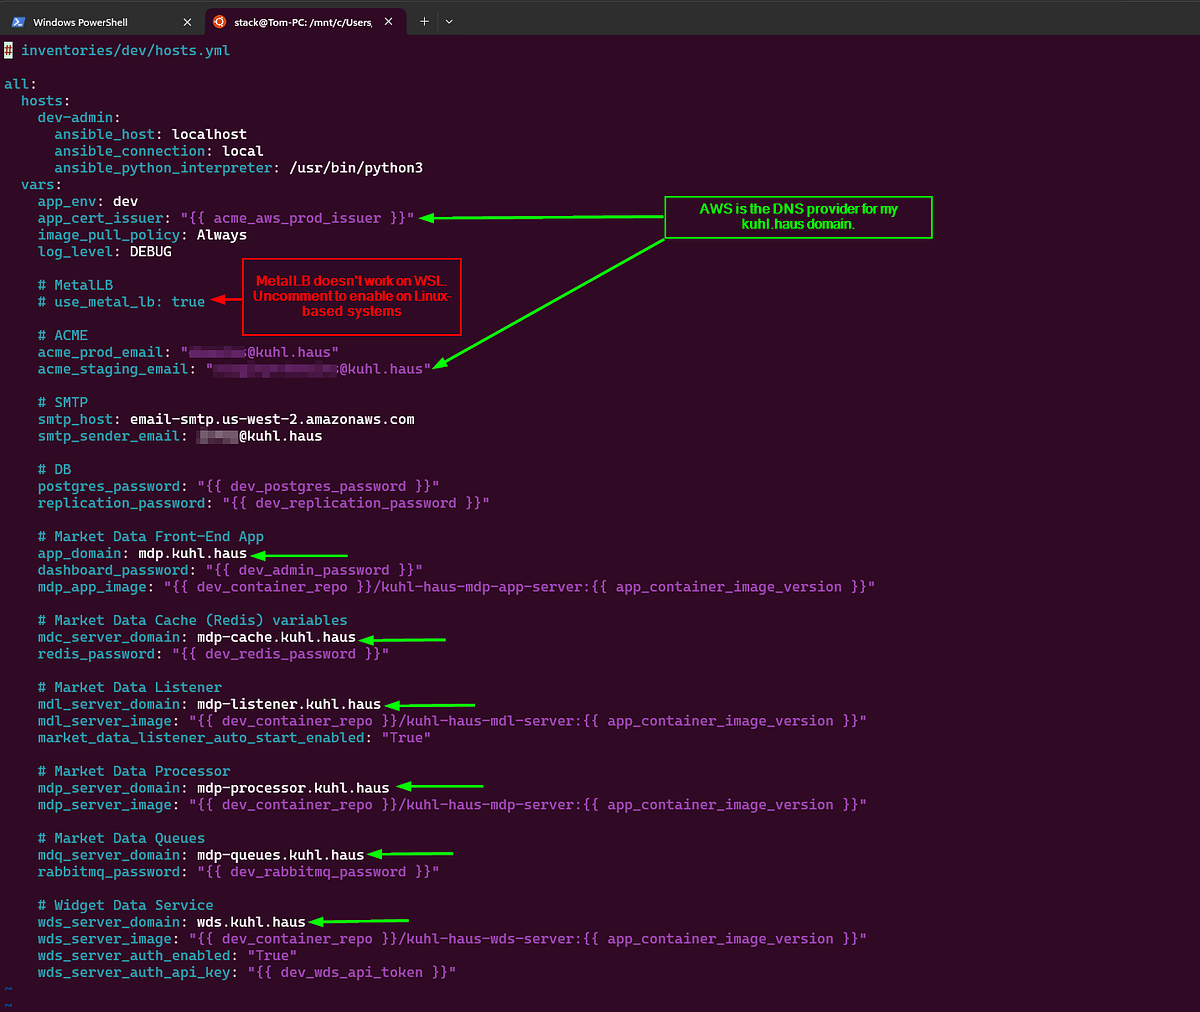
SCREENSHOT: Modified example inventory file.
Deployment Process
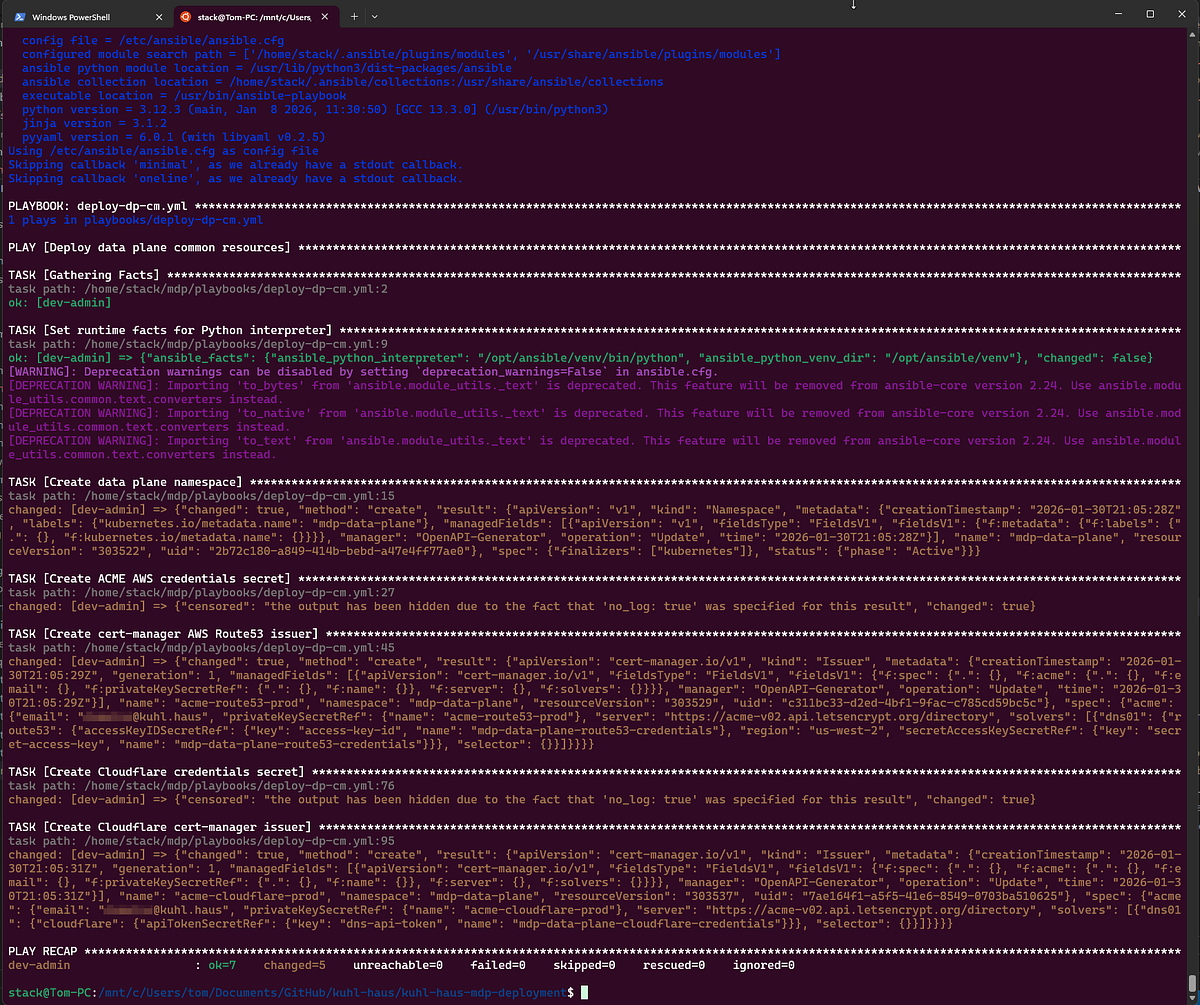
Quick housekeeping first: Install Ansible dependencies with the prerequisites playbook. Takes about 30 seconds to create a Python venv and install the Kubernetes module.
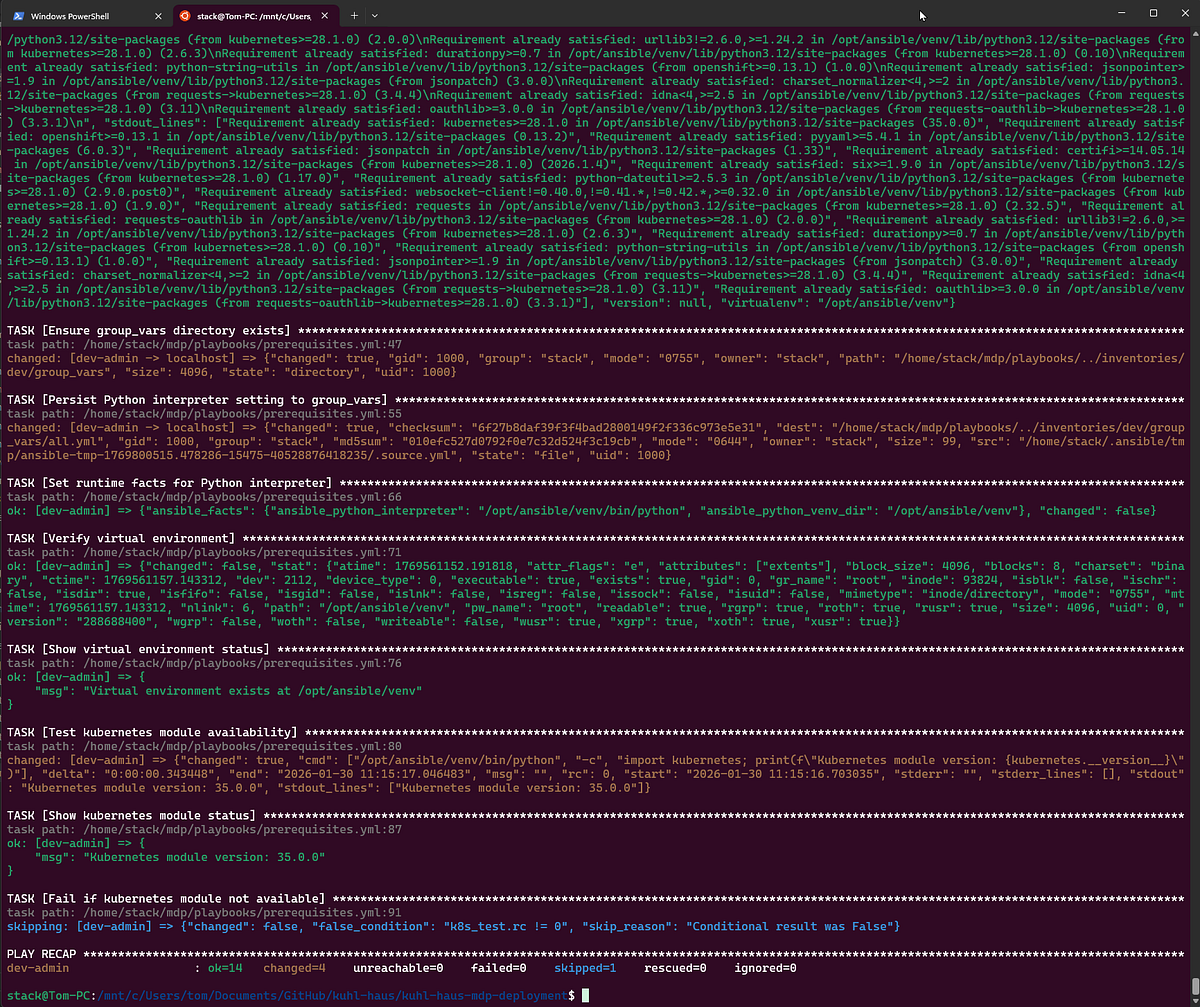
SCREENSHOT: Prerequisites installation output
Phase 1: Base Kubernetes infrastructure
This is where deployment gets interesting — and where Docker Desktop diverges from production clusters.
Cloud providers use proprietary networking (CNI) and storage (CSI) plugins. Once you configure those, though, everything else is mostly portable. That’s the whole point of Kubernetes — abstraction that keeps you from getting completely locked into one vendor.
Storage: The Easy Part
Production uses Ceph with RADOS Block Device (csi-rbd-sc storage class). Docker Desktop? Just change one variable to hostpath in ansible/group_vars/all.yml. Done.
Networking: The Fun Part
Here’s where I hit my first real snag.
In production, I run MetalLB for load balancing with NGINX ingress. MetalLB assigns virtual IPs to services using Layer 2 ARP. Works beautifully on bare metal Ubuntu nodes.
Docker Desktop? Nope.
The problem: Docker Desktop runs Kubernetes inside a VM (even on WSL2). MetalLB’s ARP responses happen inside that VM, not on your physical network interface. Your host network never sees the advertisements. You deploy everything, health checks pass, and… you can’t reach anything.
I spent 20 minutes checking NGINX configs before I remembered the VM layer.
The fix: Don’t use MetalLB on Docker Desktop. Just skip it. NGINX will bind directly to ports 80 and 443 on your physical interface instead. No other changes needed — the Service endpoints and ingress routes work identically.
Rather than maintaining separate playbooks, I added a conditional check. If you’re deploying to production and want MetalLB, uncomment use_metal_lb: true in your inventory file.
TLS Certificates: The Clever Part
Important: If you just want to kick the tires on localhost, stick with Docker Compose from Part 2. The Kubernetes deployment assumes you’re setting up proper hostnames and TLS certificates.
Here’s the problem I needed to solve: I want production-grade TLS certificates, but I don’t want my services exposed to the public internet. Let’s Encrypt’s HTTP-01 challenge won’t work because it requires public accessibility.
Enter split-brain DNS with ACME DNS-01 validation.
How it works:
- I register real domains with AWS Route53 and Cloudflare (public DNS zones)
- ACME DNS-01 validation checks those public zones — ✓ domains are verified
- But my internal DNS server resolves those same hostnames to private IPs
- Traffic never hits the internet — it routes internally
For production, those internal IPs point to MetalLB virtual IPs. For this Docker Desktop demo, I created internal DNS records pointing to my PC’s IP address (192.168.x.x or whatever your WSL2 interface uses).
The result: Real, valid TLS certificates for services that only exist on my internal network.
The playbook supports both AWS Route53 and Cloudflare for DNS-01 validation. You specify which provider in your inventory file, and cert-manager handles the rest.
For Docker Desktop specifically: You’ll need to set up DNS records on your local network (your router, Pi-hole, or whatever runs your internal DNS) that point your chosen hostnames to your PC. The ACME validation happens against the public zone, but the actual traffic goes to your local machine.
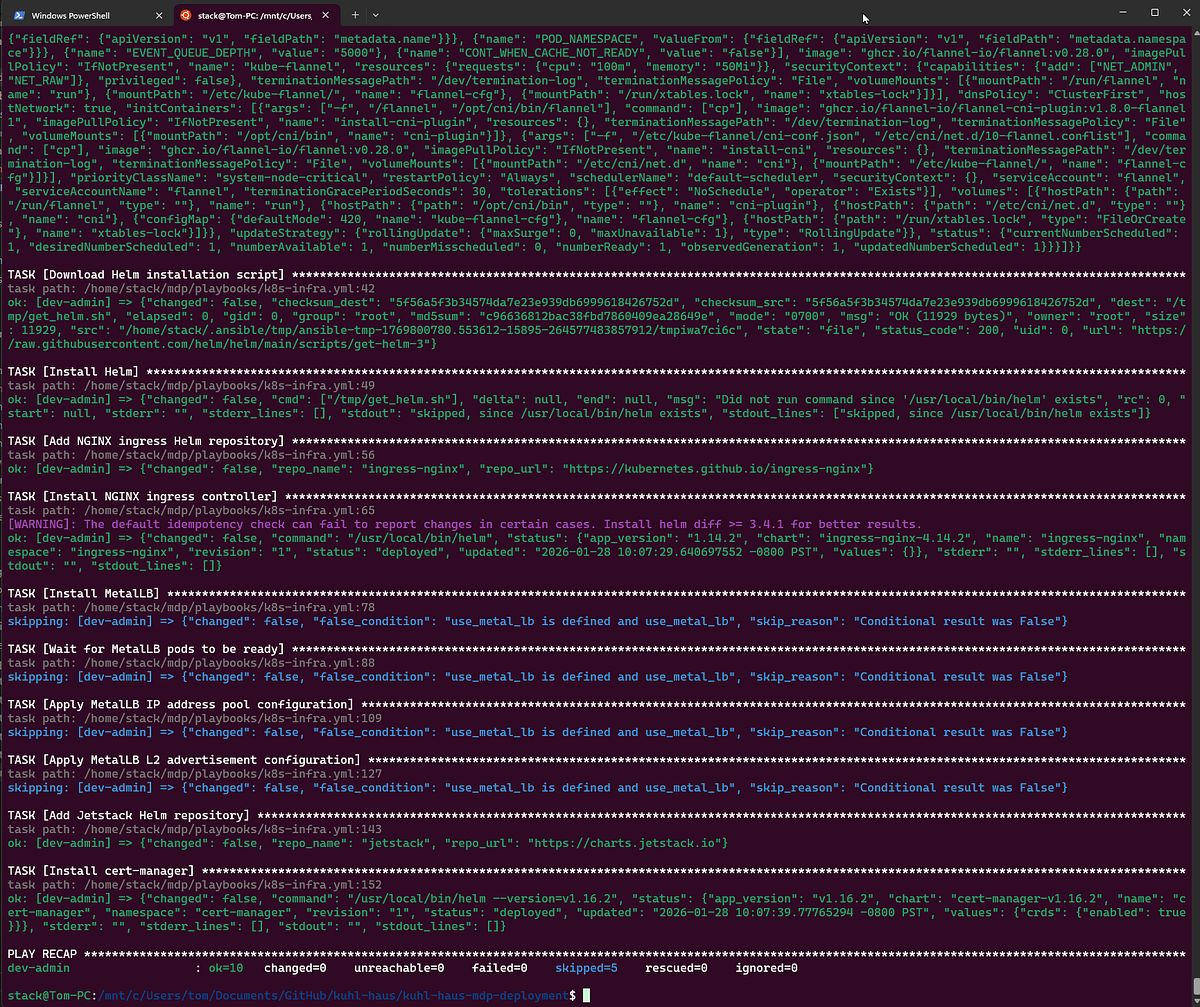
SCREENSHOT: k8s-infra.yml playbook completed successfully
Phase 2: Frontend Deployment
Here’s where we find out if everything actually works.
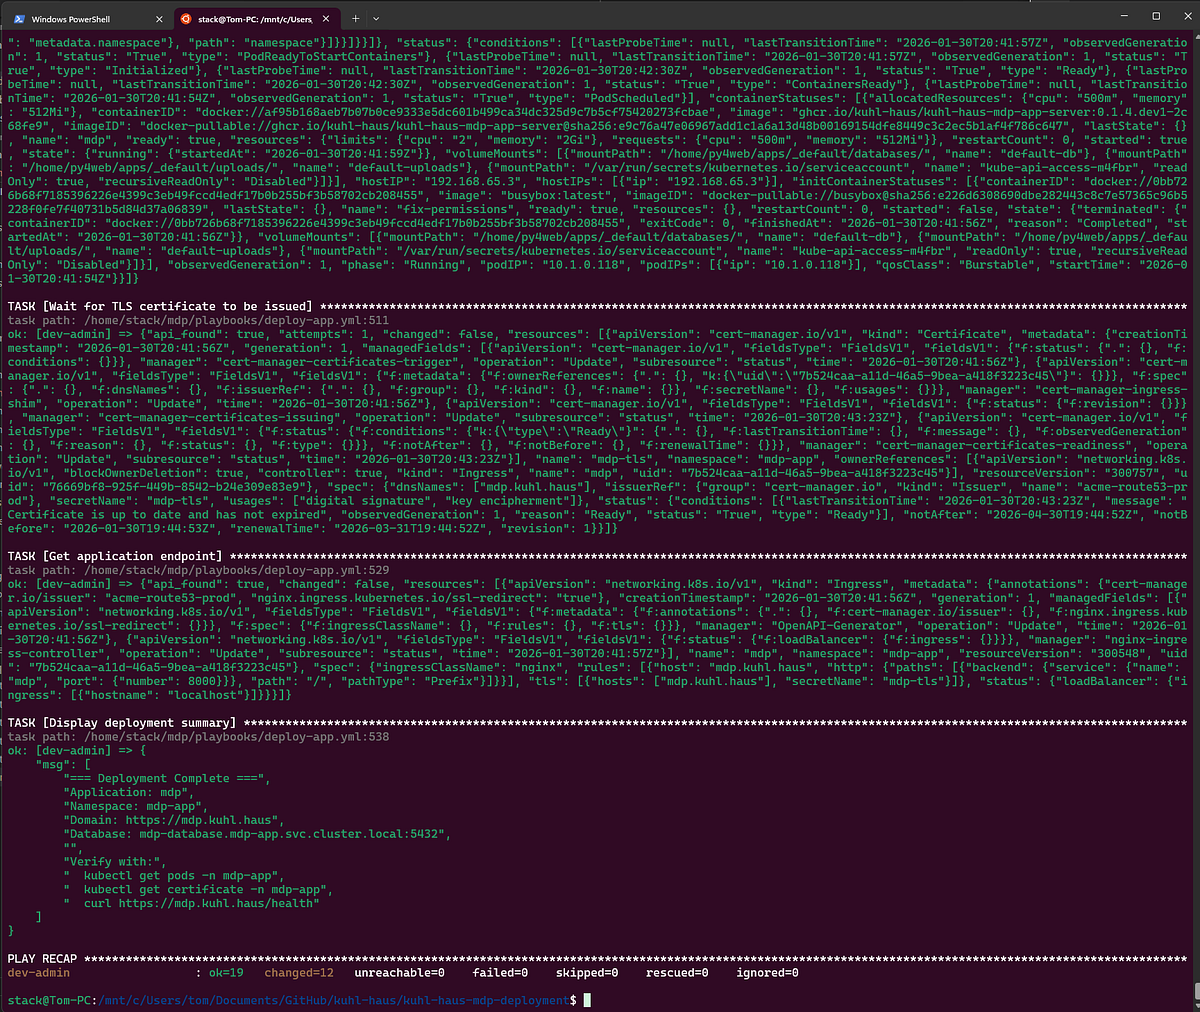
SCREENSHOT: Showing deployment summary and verification steps
The Version Verification Trick
Remember in Part 2 when I said not to worry about container_image and image_version showing as “Unknown”? That was Docker Compose running locally with no git context.
In Kubernetes, those fields show real values: ghcr.io/kuhl-haus/kuhl-haus-mdp-app-server:0.1.4.dev1-2c68fe9 and 0.1.4.dev1-2c68fe9.
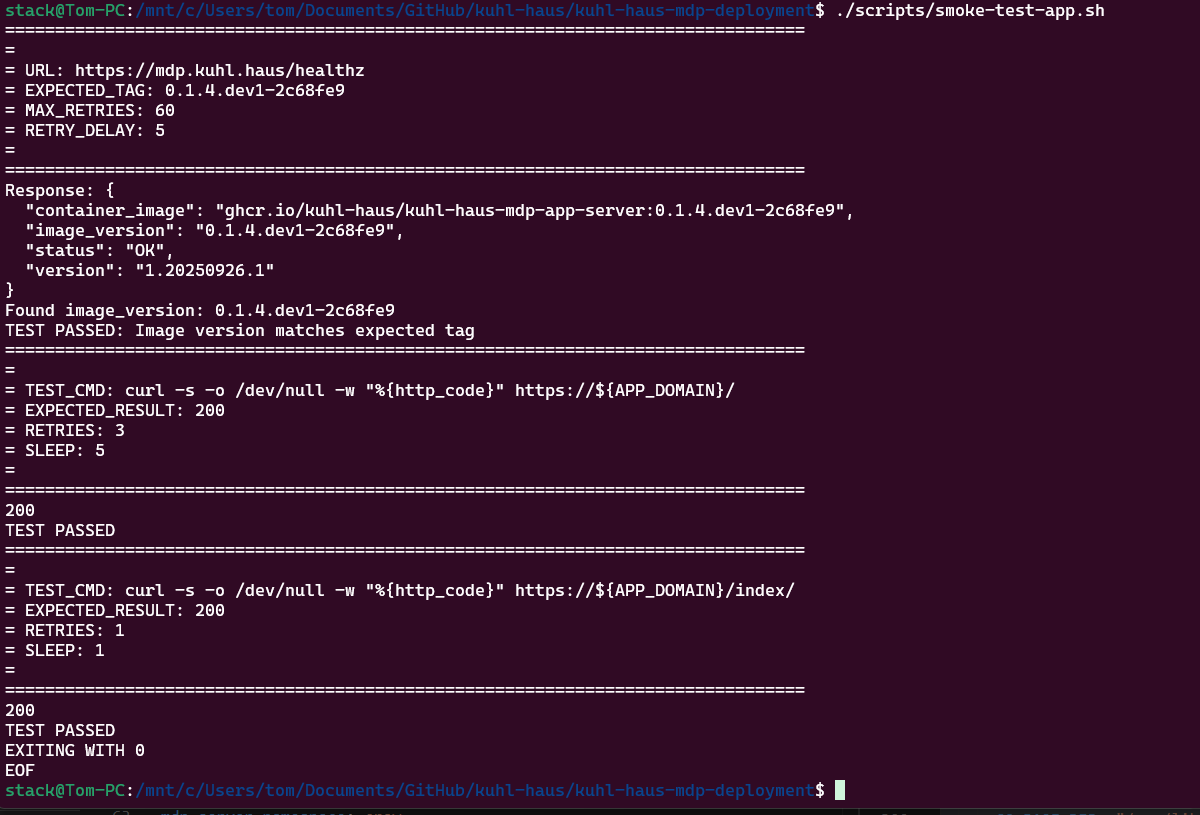
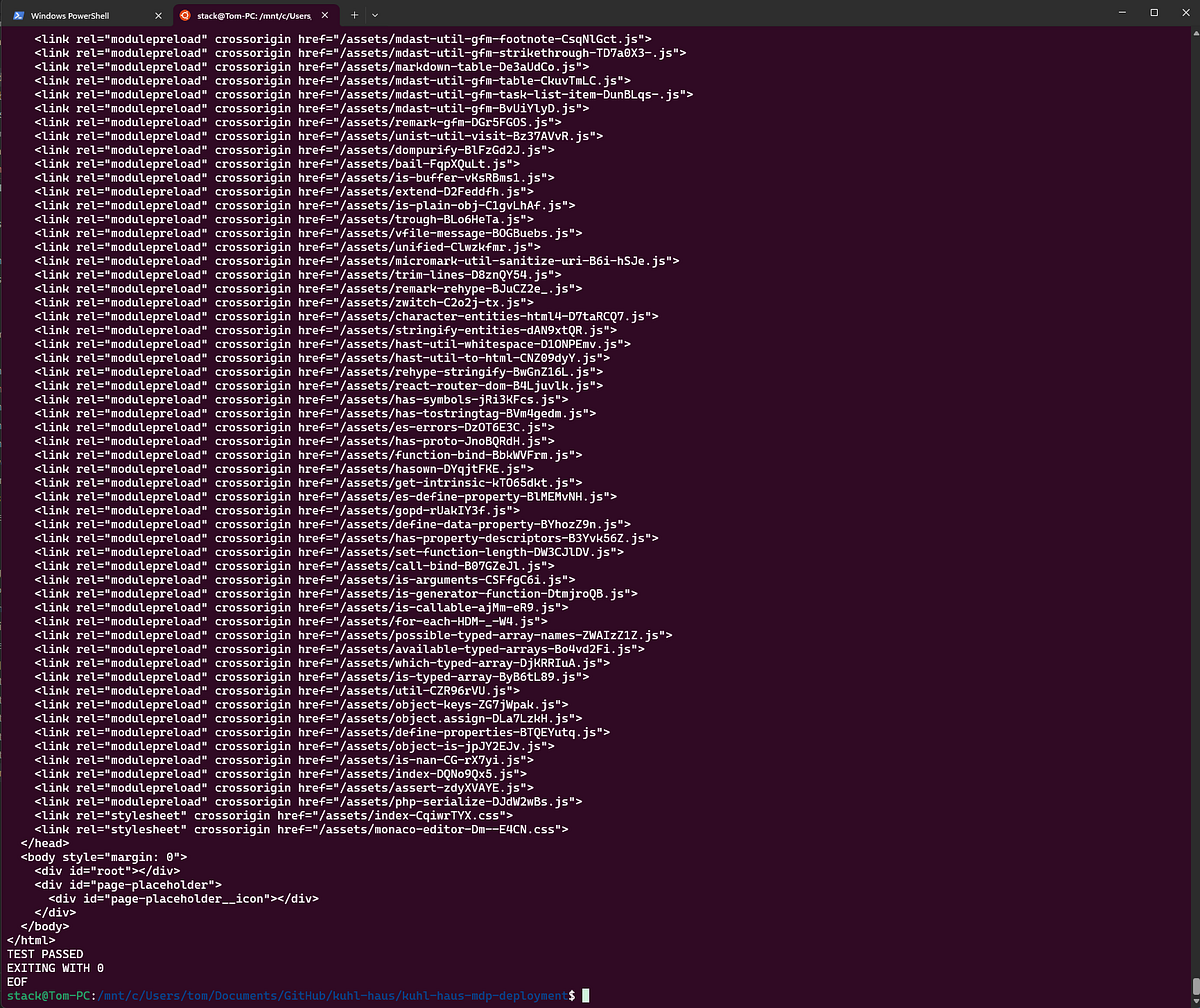
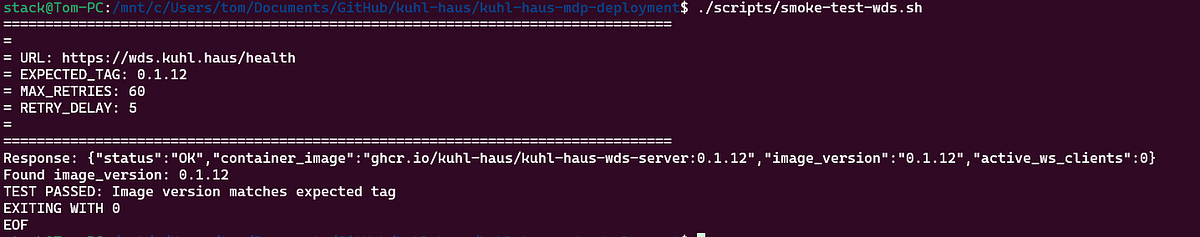
SCREENSHOT: Smoke test script inspecting image tag returned from health check endpoint
Why this matters: The deployment scripts use the same logic as the image build pipeline to calculate version tags from git commit history. That’s why you needed to clone the repos — not for the code, but for the git history.
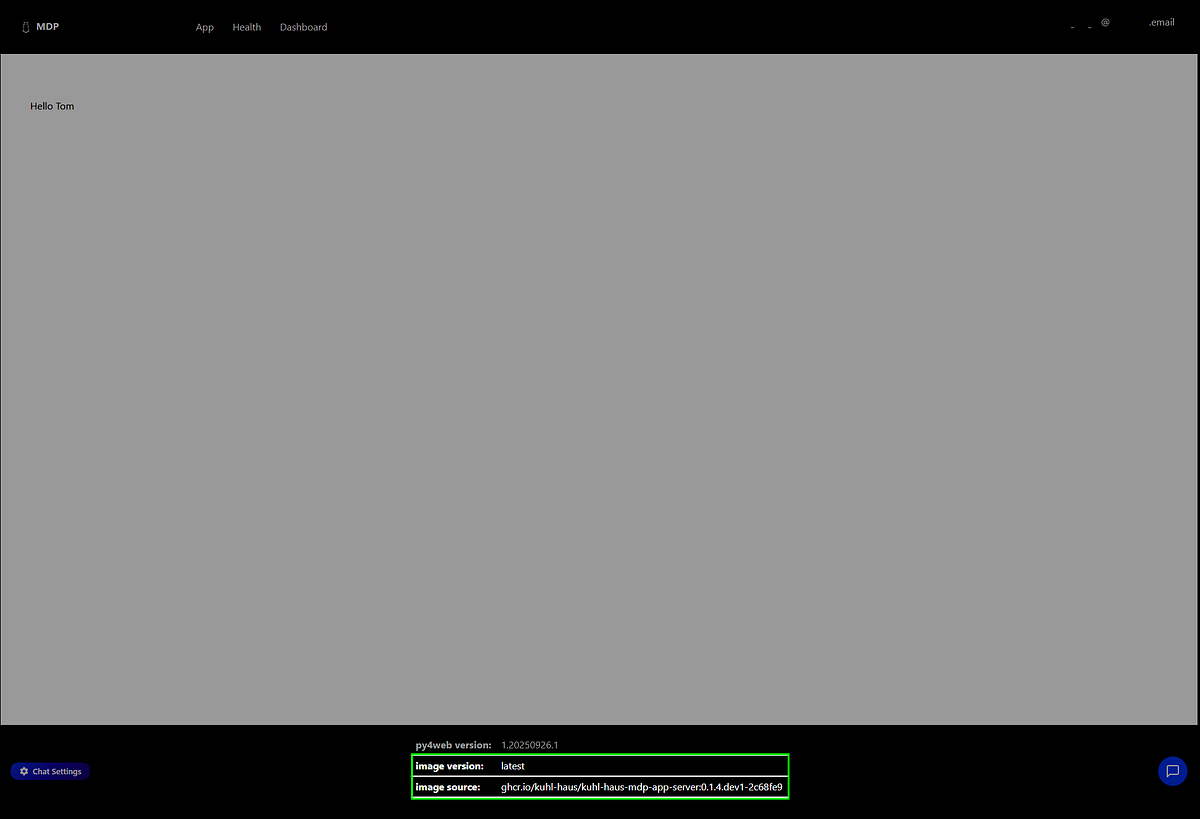
SCREENSHOT: App landing page with image version and image source highlighted
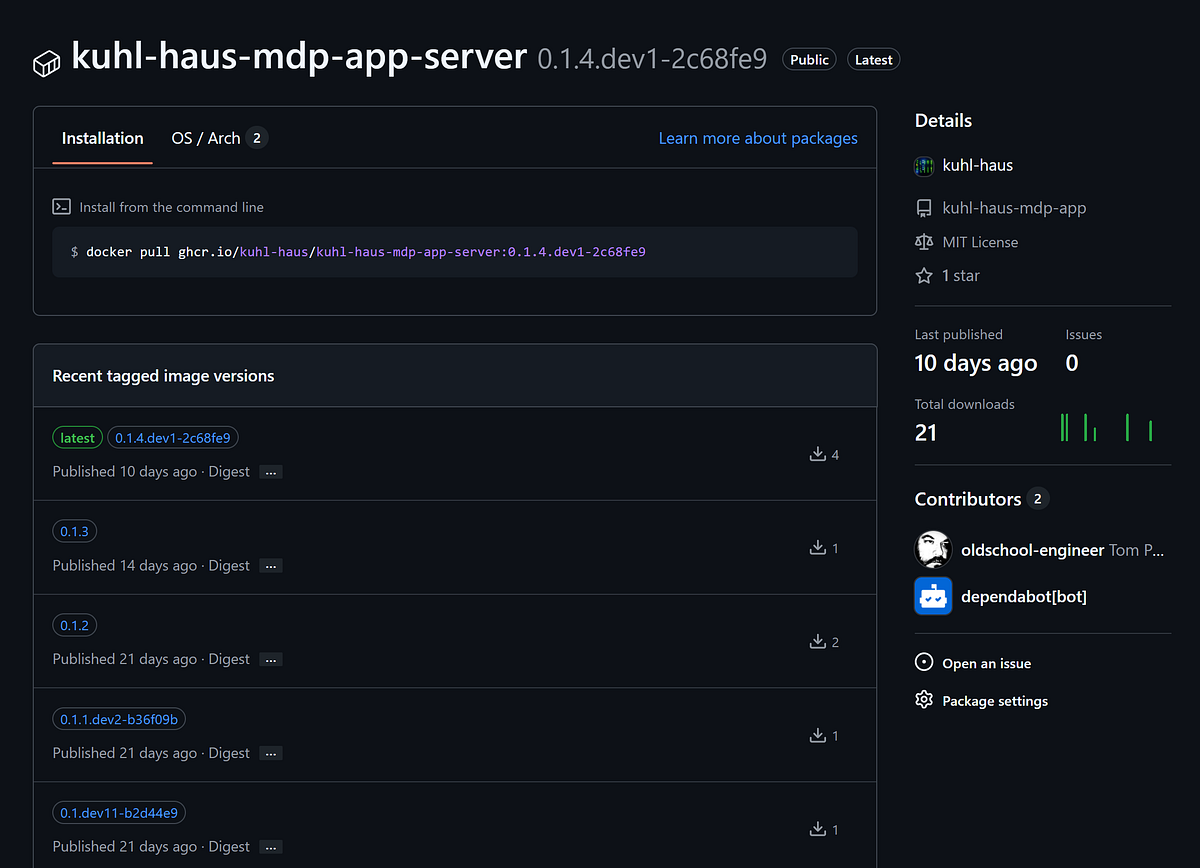
Checking the GitHub packages confirms 0.1.4.dev1-2c68fe9 is indeed the latest image.
Why Simple Health Checks Aren’t Enough
Here’s the problem with basic smoke tests: they’ll tell you if something is running, but not if your new version deployed successfully.
Kubernetes does blue/green deployments. If a new pod fails health checks, it never enters the load balancer rotation. The old version keeps serving traffic. Your health check endpoint returns 200 OK… from the old pods.
Everything looks fine. Your deployment failed.
My smoke test script checks the version tag in the health check response. If it doesn’t match what I just deployed, the script fails. This catches deployment failures while maintaining high availability — the old version stays up, I get alerted, and I can investigate without taking an outage.
This is also why I run a pre-production environment. Upgrade all PPE nodes first, verify the version-tagged health checks pass, then move to production with confidence.
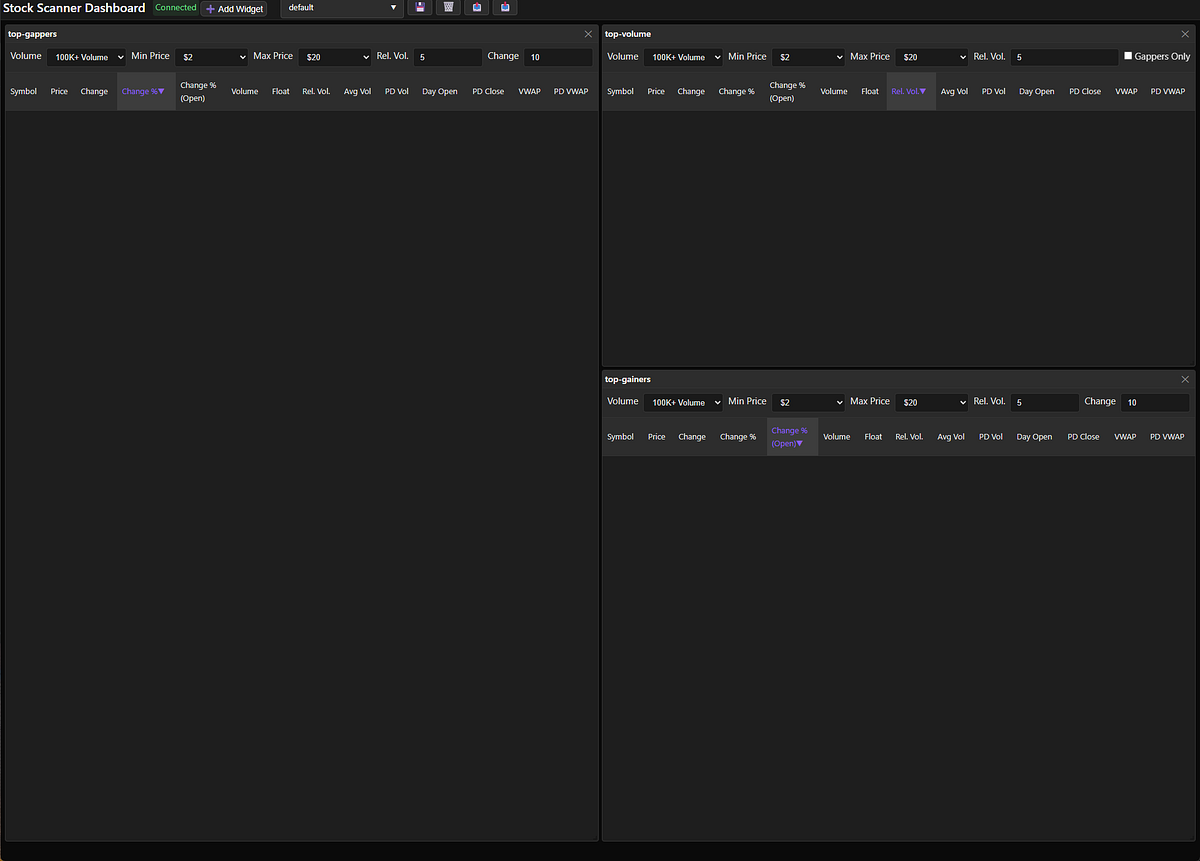
SCREENSHOT: No market data… yet.
Phase 3: Backend Data Plane (The Order Matters)
Unlike the frontend, the backend components deploy sequentially. Not for fun — because they have dependencies that’ll bite you if you ignore them.
WARNING — RACE CONDITION: The Market Data Processor won’t start if the Market Data Listener hasn’t created its RabbitMQ queues yet. The MDL owns queue creation and only does it on first run. Deploy MDP first? It crashes looking for queues that don’t exist.
So: sequential deployment, dependency order enforced.
Certificate Manager
Quick housekeeping: each namespace needs its own cert-manager to issue certificates. Frontend and data plane are isolated — the frontend cert-manager can’t issue certs for backend services.
SCREENSHOT: certificate manager deployment
Market Data Cache (Redis)
In production, Redis runs with authentication. For this demo, I skipped the password so I could show you the Redis browser interface and capture screenshots of the cache state.
Is this how you should run Redis? No. Is it fine for a local demo that never touches the internet? Yes.
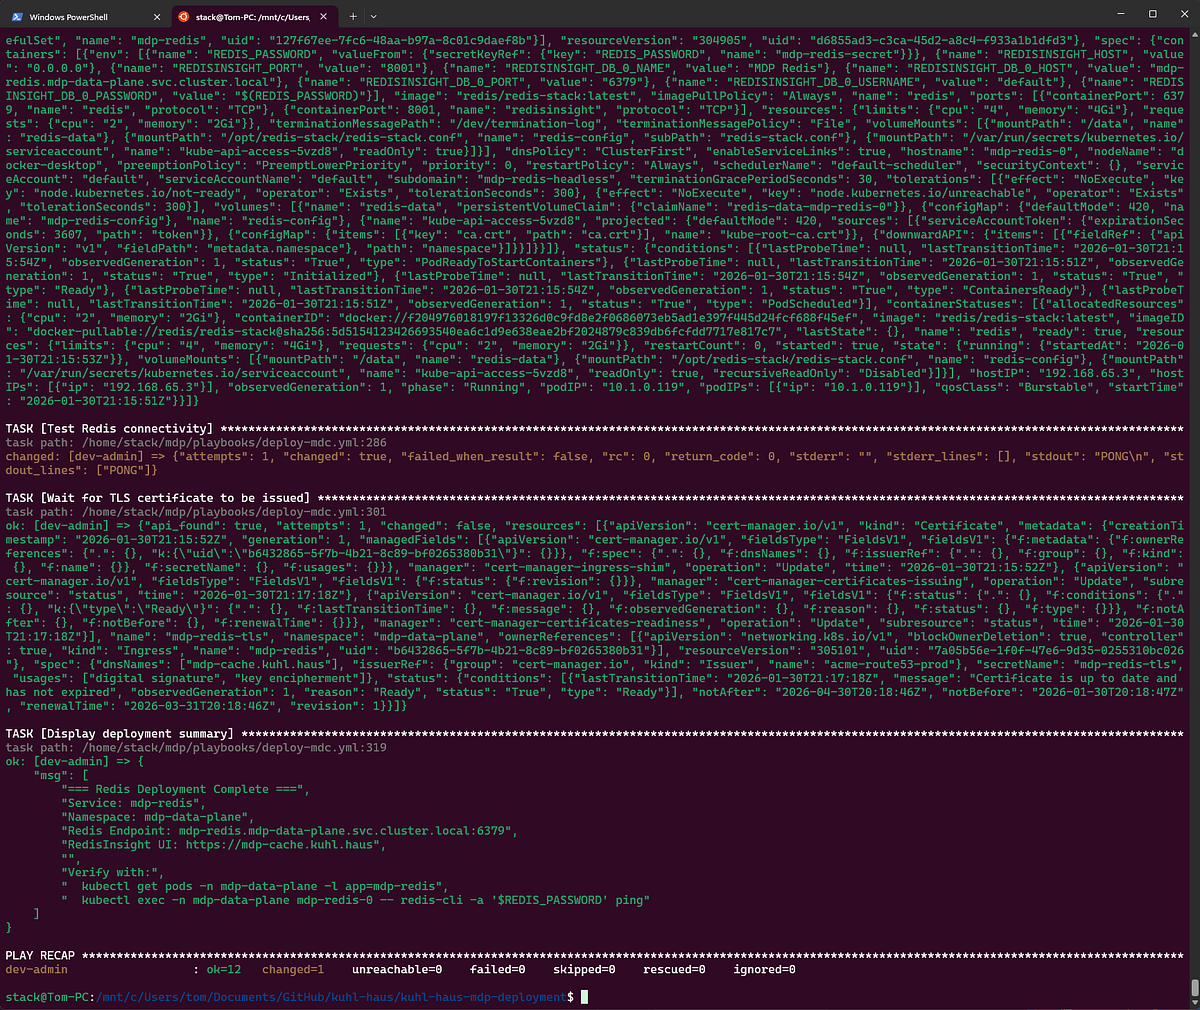
SCREENSHOT: deployment summary for Redis
SCREENSHOT: Smoke test Market Data Cache
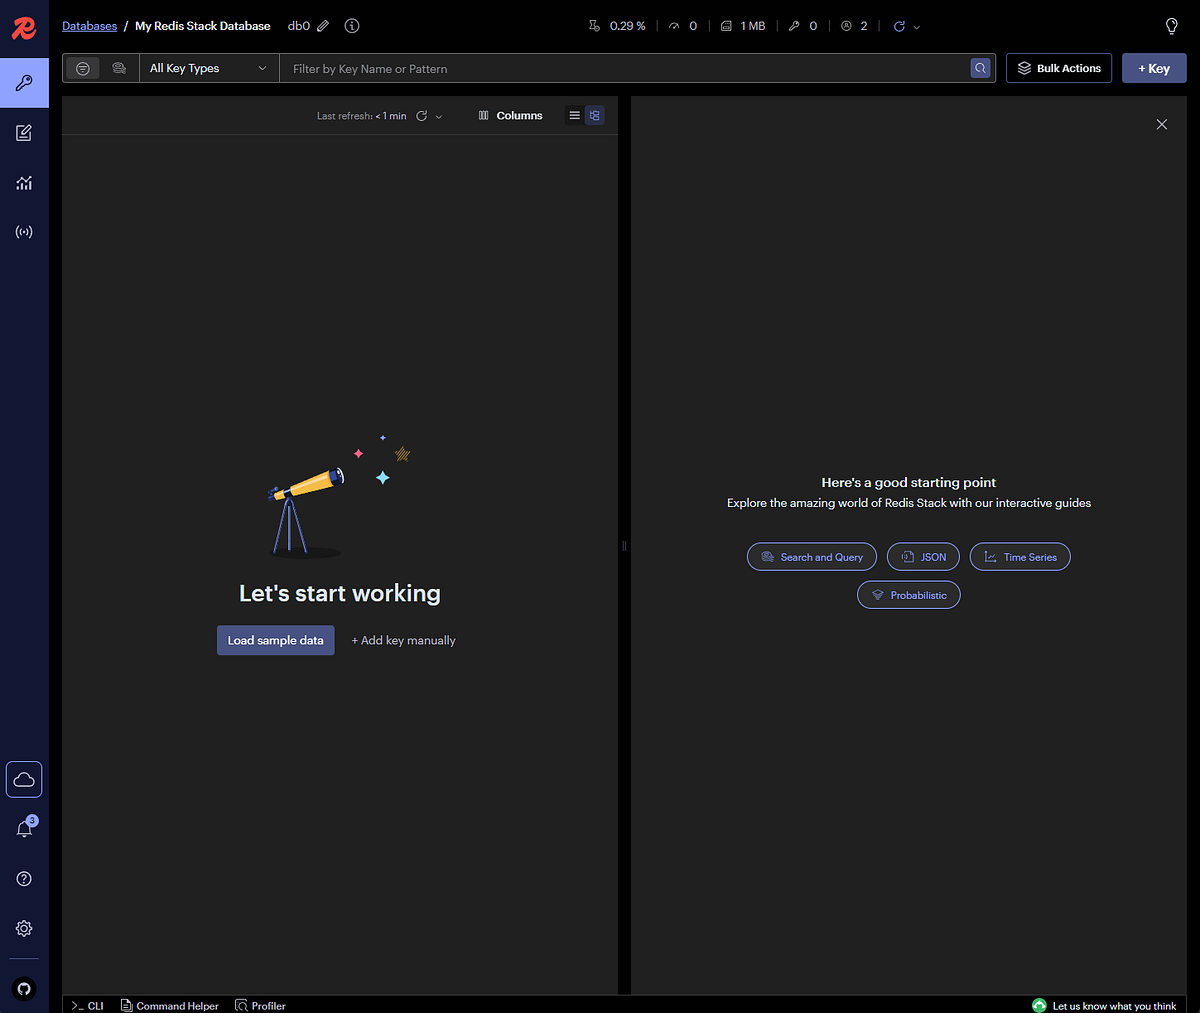
SCREENSHOT: Optional Redis Browser Interface
Market Data Queues (RabbitMQ)
Same deal — I enabled the management dashboard metrics collector, which RabbitMQ deprecated in favor of Prometheus. But Prometheus metrics don’t make good screenshots, and you’re not running this in production anyway.
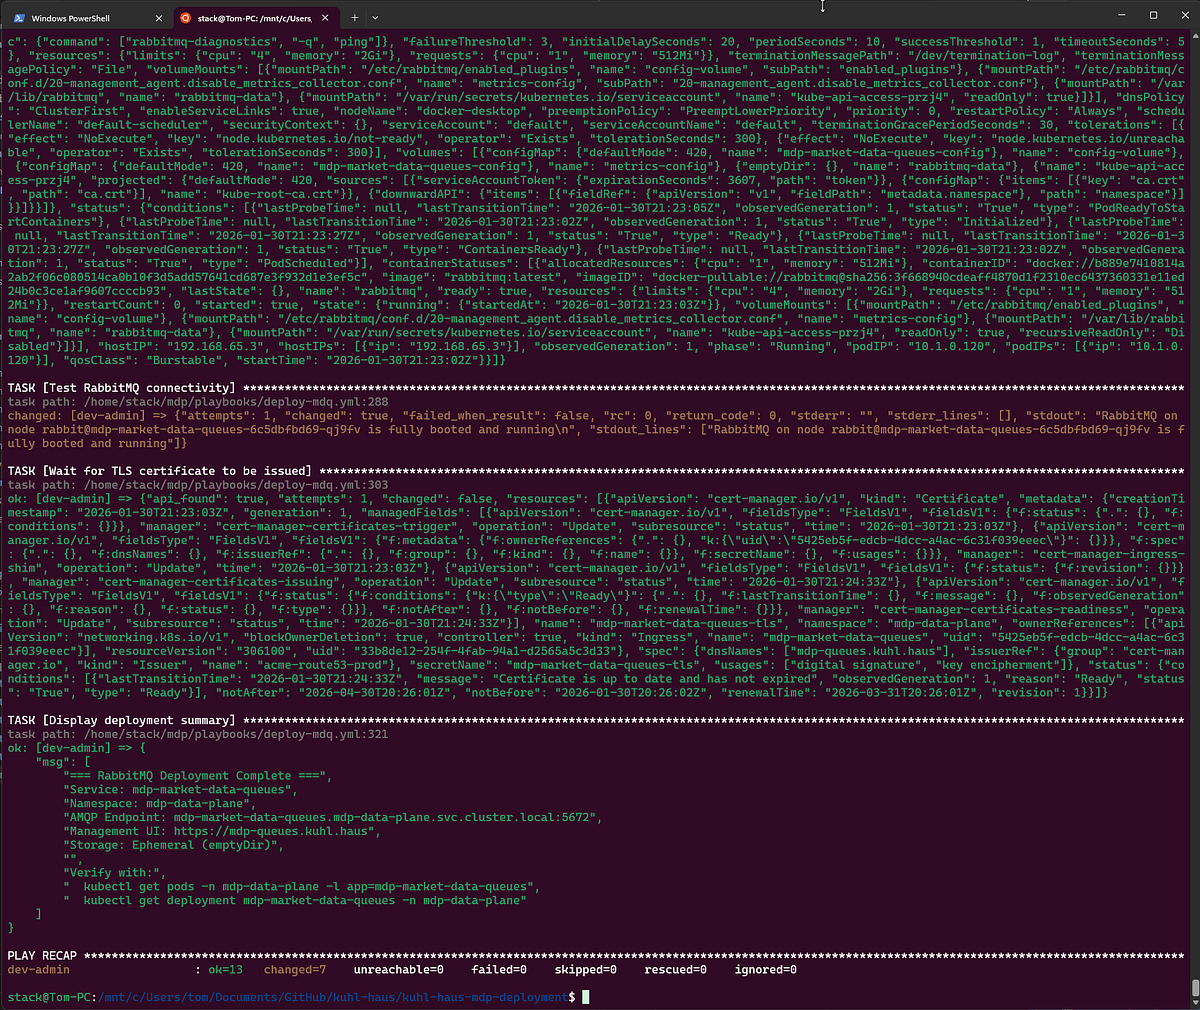
SCREENSHOT: RabbitMQ deployment summary
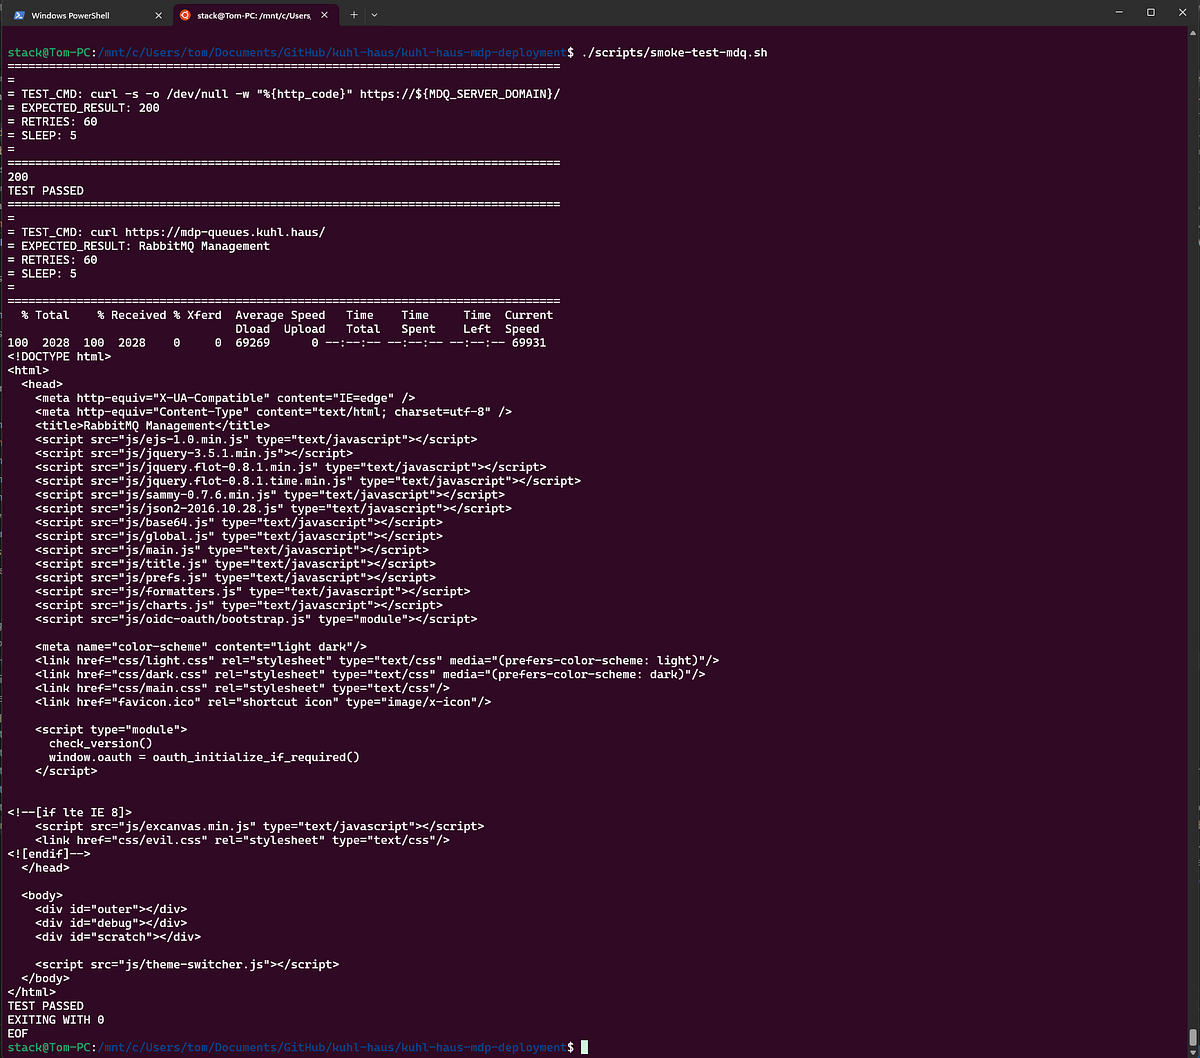
SCREENSHOT: RabbitMQ smoke test script output
Market Data Listener
Now we’re back to my code, which means we’re back to version-tagged health checks.
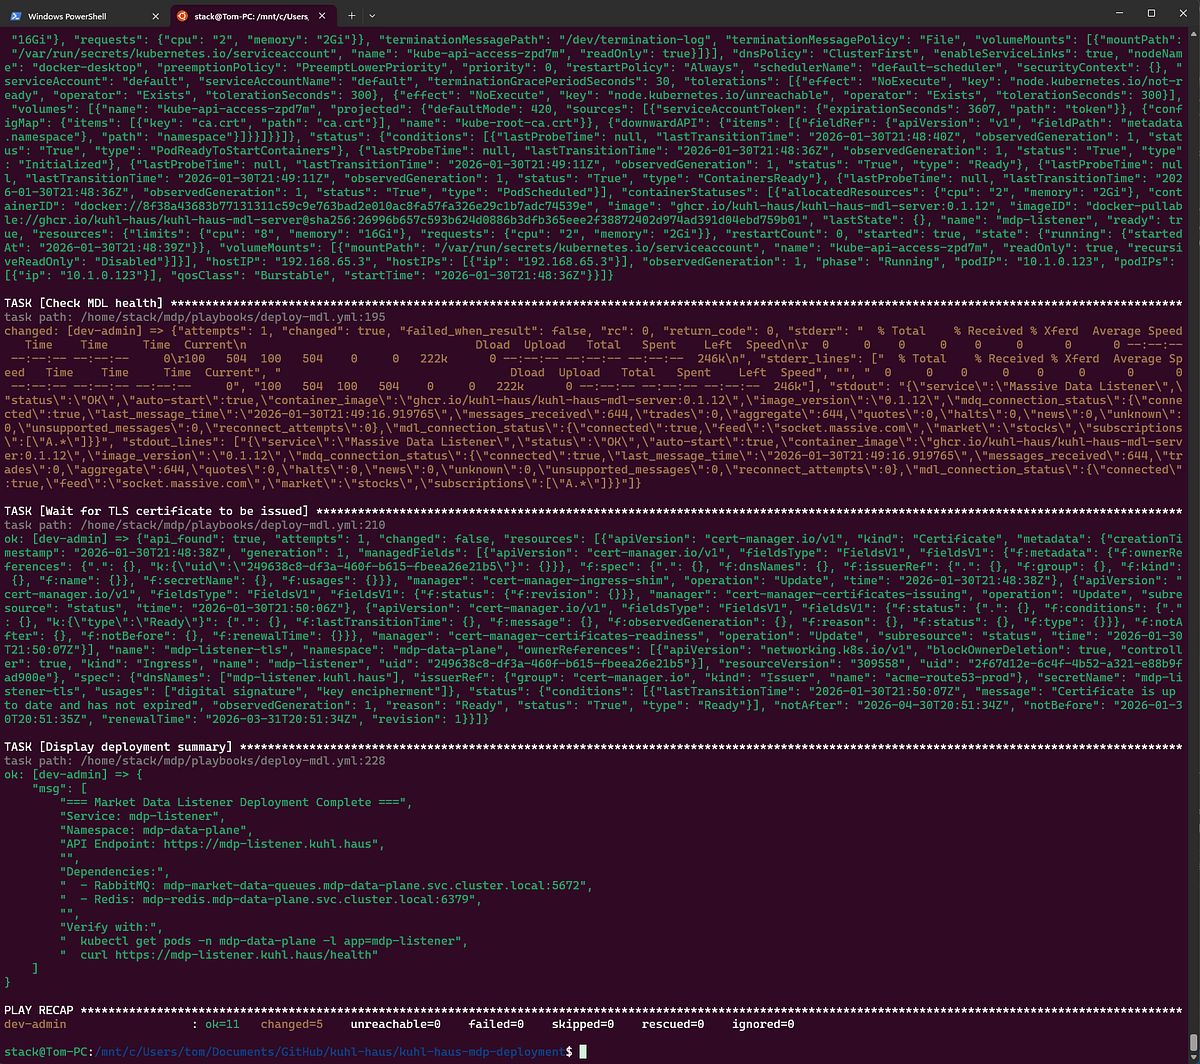
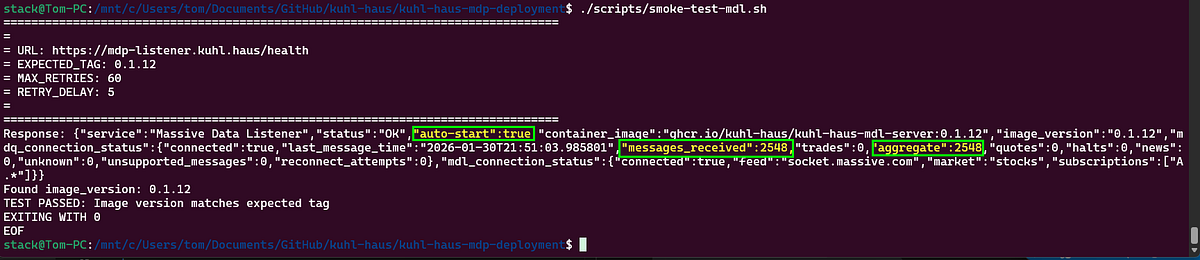
Notice the smoke test validates the image tag? Every component I built emits image_version and container_image from its health endpoint. Redis and RabbitMQ are third-party - they don’t have this verification built in.
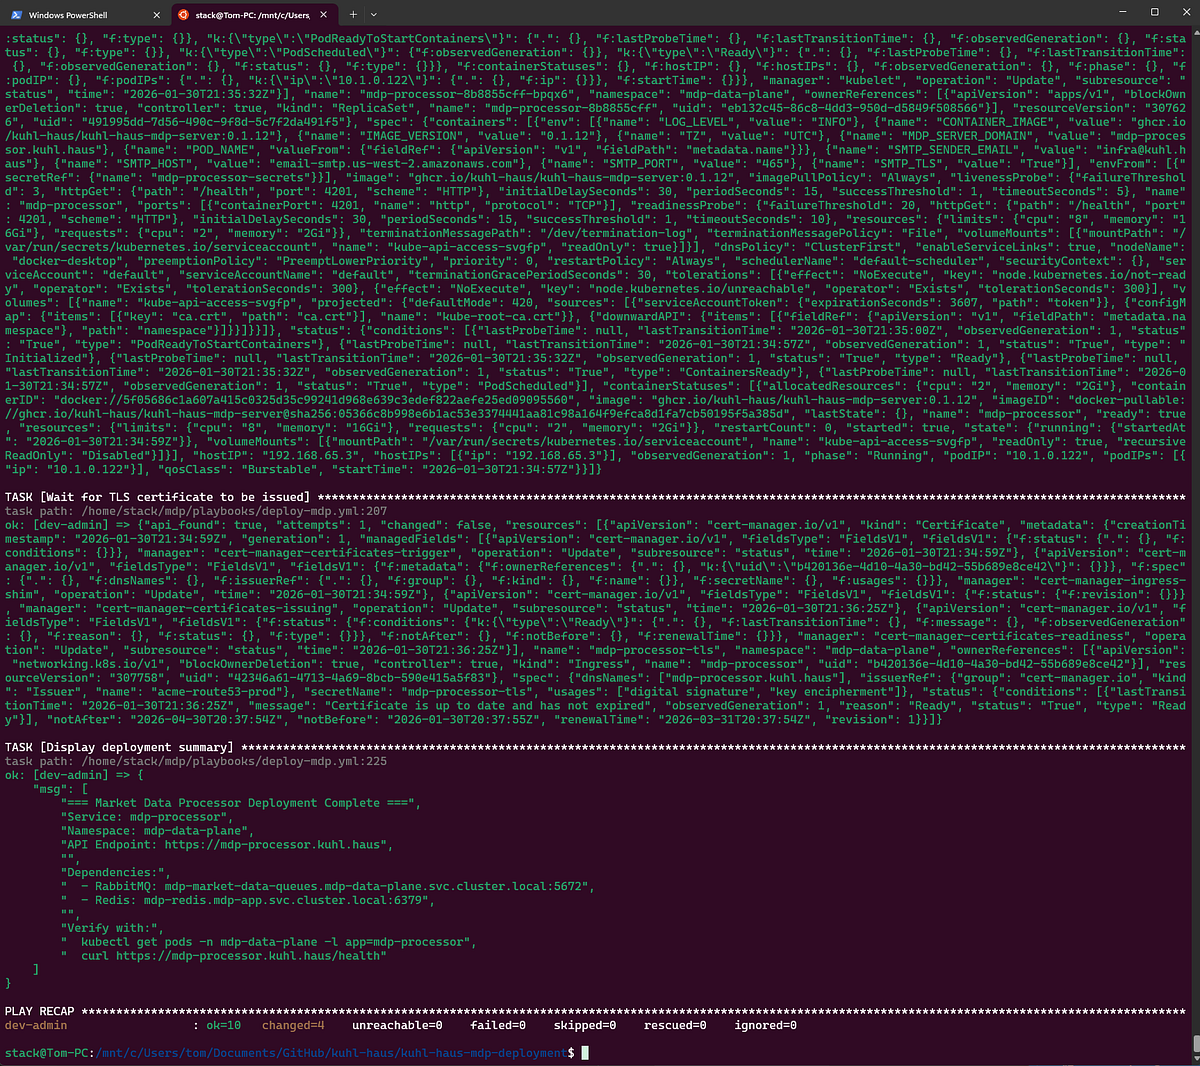
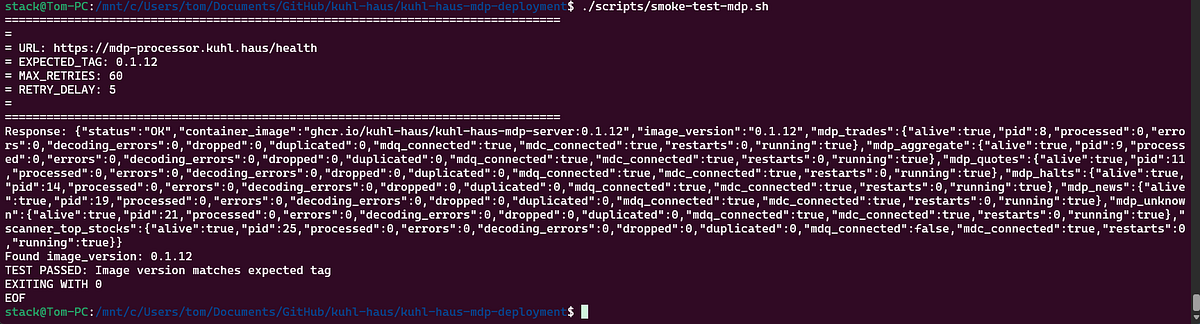
Market Data Processors
This is the component that crashes if the MDL hasn’t run first. With the MDL deployed, the queues exist, and the MDP starts cleanly.
Widget Data Service
Final piece of the backend puzzle.
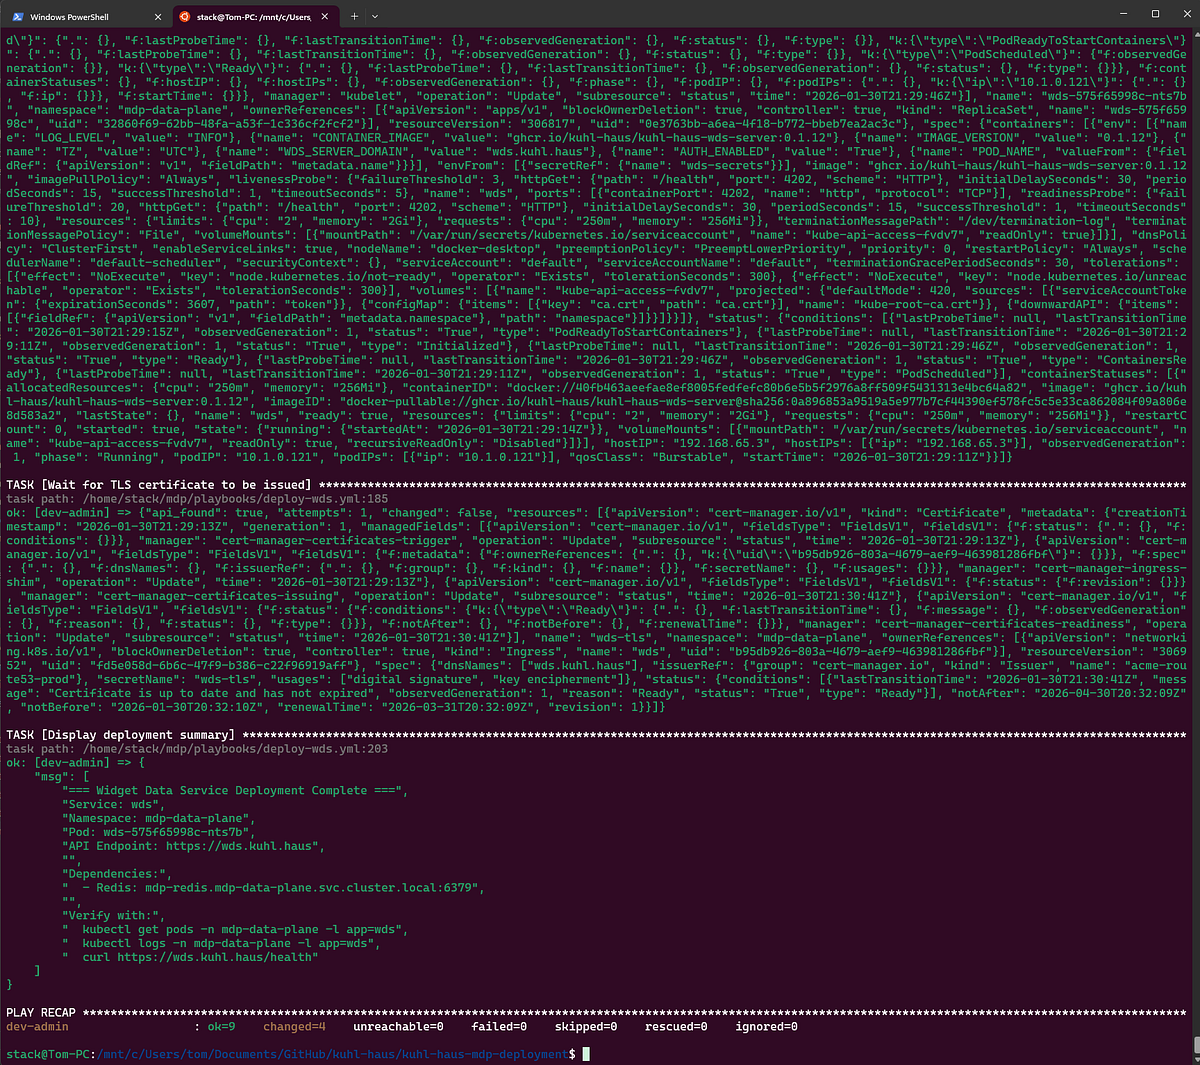
SCREENSHOT: Widget Data Service smoke test script
End-to-End Verification and Testing
Time to see if this thing actually works.
Open the app and… yes, data is flowing. Scanners are populating. But let’s trace exactly how that data got there — this doubles as a tour of the data pipeline.
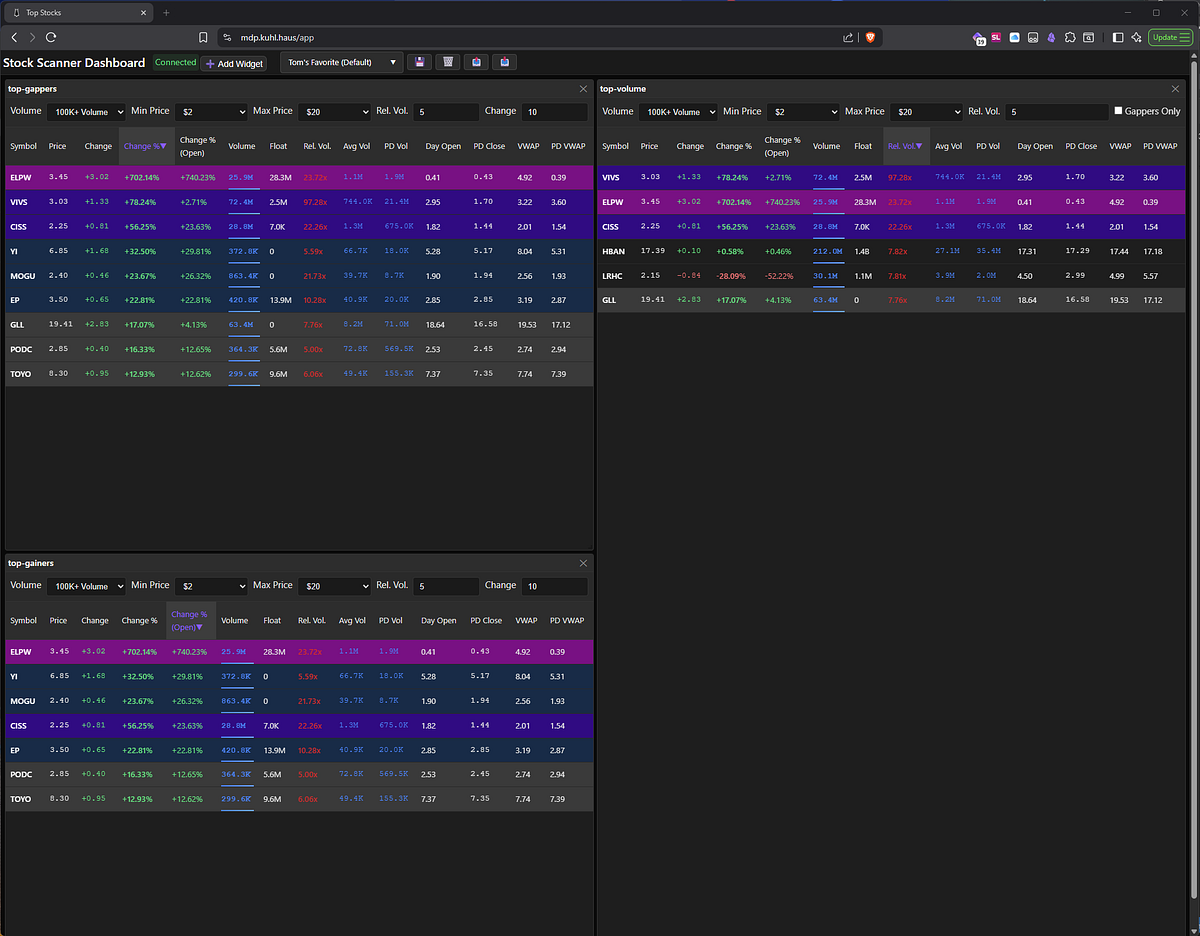
SCREENSHOT: Stock Scanner Dashboard with populated scanners
Step 1: Market Data Listener
The MDL connects to your market data feed and processes incoming messages. Hit the health endpoint and you get the full picture:
{
  "service": "Massive Data Listener",
  "status": "OK",
  "container_image": "ghcr.io/kuhl-haus/kuhl-haus-mdl-server:0.1.12",
  "image_version": "0.1.12",
  "mdq_connection_status": {
    "connected": true,
    "last_message_time": "2026-01-31T00:09:04.870812",
    "messages_received": 98246,
    "aggregate": 98246
  },
  "mdl_connection_status": {
    "connected": true,
    "feed": "socket.massive.com",
    "market": "stocks",
    "subscriptions": ["A.*"]
  }
}
What this tells us:
- Image version matches what we just deployed (0.1.12) ✓
- Connected to both the market data feed AND RabbitMQ ✓
- Processed 98,246 aggregate messages (and counting) ✓
- Last message came in seconds ago ✓
- Subscribed to per-second Aggregate events for all stocks ✓
That’s a healthy listener. Messages are flowing into RabbitMQ queues.
Step 2: RabbitMQ Queues
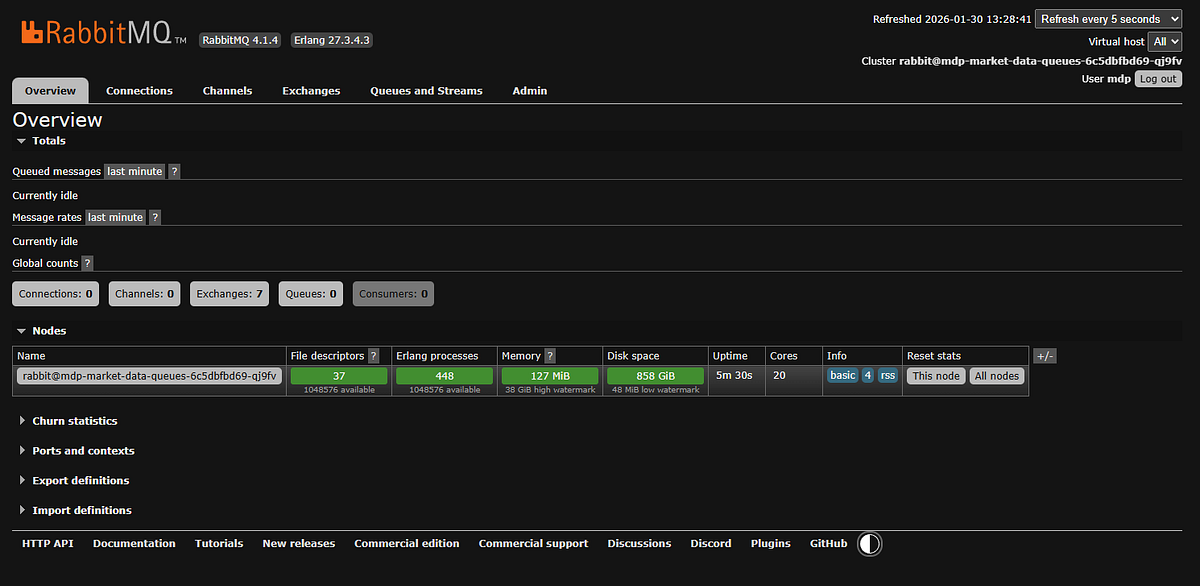
If messages were piling up here, it’d mean the processors aren’t keeping pace. But the queues are empty — good sign. Messages are flowing through, not backing up.
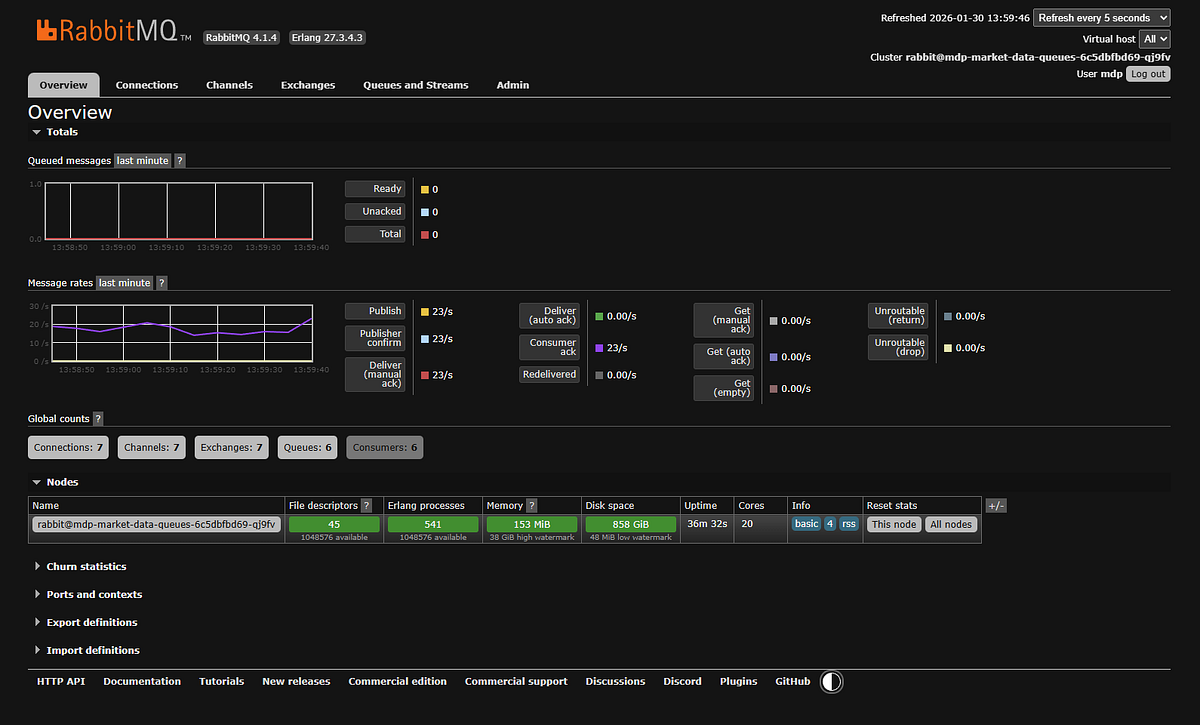
SCREENSHOT: RabbitMQ dashboard showing no queued messages.
Minor embarrassment: The dashboard shows 23 messages per second. I advertised this thing as handling 1,000+ messages per second, so what gives?
I’m running this demo after market close. Traffic right now is basically nothing — a few late trades trickling in, some after-hours activity. At 9:30 AM Eastern when market opens and every stock is moving? Yeah, then you get your 1,000+ msg/sec.
Timing is everything in stock market demos, apparently.
Step 3: Market Data Processor
The MDP pulls messages from RabbitMQ, processes them, and writes results to Redis. The health check shows what’s actually happening:
{
  "status": "OK",
  "container_image": "ghcr.io/kuhl-haus/kuhl-haus-mdp-server:0.1.12",
  "image_version": "0.1.12",
  "mdp_aggregate": {
    "alive": true,
    "pid": 9,
    "processed": 99071,
    "errors": 0,
    "mdq_connected": true,
    "mdc_connected": true,
    "restarts": 0,
    "running": true
  },
  "mdp_trades": {
    "alive": true,
    "processed": 0,
    ...
  },
  "scanner_top_stocks": {
    "alive": true,
    "processed": 99070,
    "errors": 0,
    "mdc_connected": true,
    "restarts": 0,
    "running": true
  }
}
What’s happening here:
The MDP runs separate processors for different message types — trades, aggregates, quotes, halts, news. Only aggregate messages are flowing (those 99,071 processed messages) because that’s all I’m subscribed to. Everything else shows zero because those message types aren’t coming in. If I changed my subscription, those processors would immediately start processing the new message types.
Notice scanner_top_stocks has processed 99,070 messages - one less than the aggregate processor. That scanner consumes the aggregate stream and maintains the leaderboards in Redis. It’s keeping perfect pace.
The zero errors thing: No decoding errors, no duplicates, no restarts. All processors show mdq_connected: true (RabbitMQ) and mdc_connected: true (Redis). Clean operation.
Version matches deployment (0.1.12) ✓
Step 4: Redis Cache
This is where processed data lives. The browser shows keys being populated in real-time:
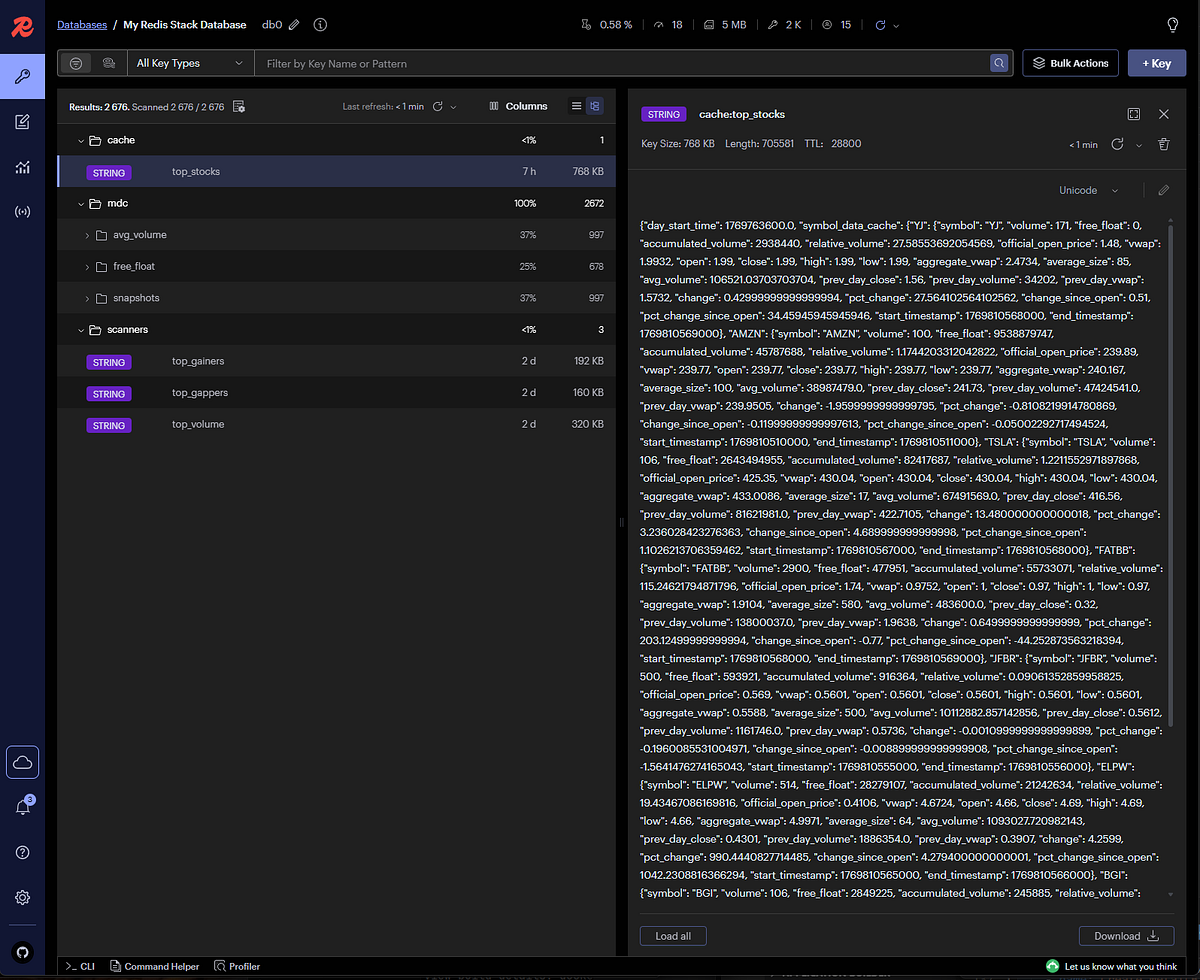
SCREENSHOT: Redis browser showing cache steadily being populated by the market data processor
Each key corresponds to a specific data aggregation — top gainers, top volume, top gappers, etc.
Step 5: Widget Data Service → Frontend
The Widget Data Service is a WebSocket interface to Redis. Its health check is simple but tells you everything you need:
{
  "status": "OK",
  "container_image": "ghcr.io/kuhl-haus/kuhl-haus-wds-server:0.1.12",
  "image_version": "0.1.12",
  "active_ws_clients": 3
}
Version matches (0.1.12) ✓
Three active WebSocket clients — that’s the three widgets I have open in my browser right now. Each widget is a separate WebSocket connection subscribing to specific Redis cache keys.
Open browser dev tools and you can watch the WebSocket traffic:
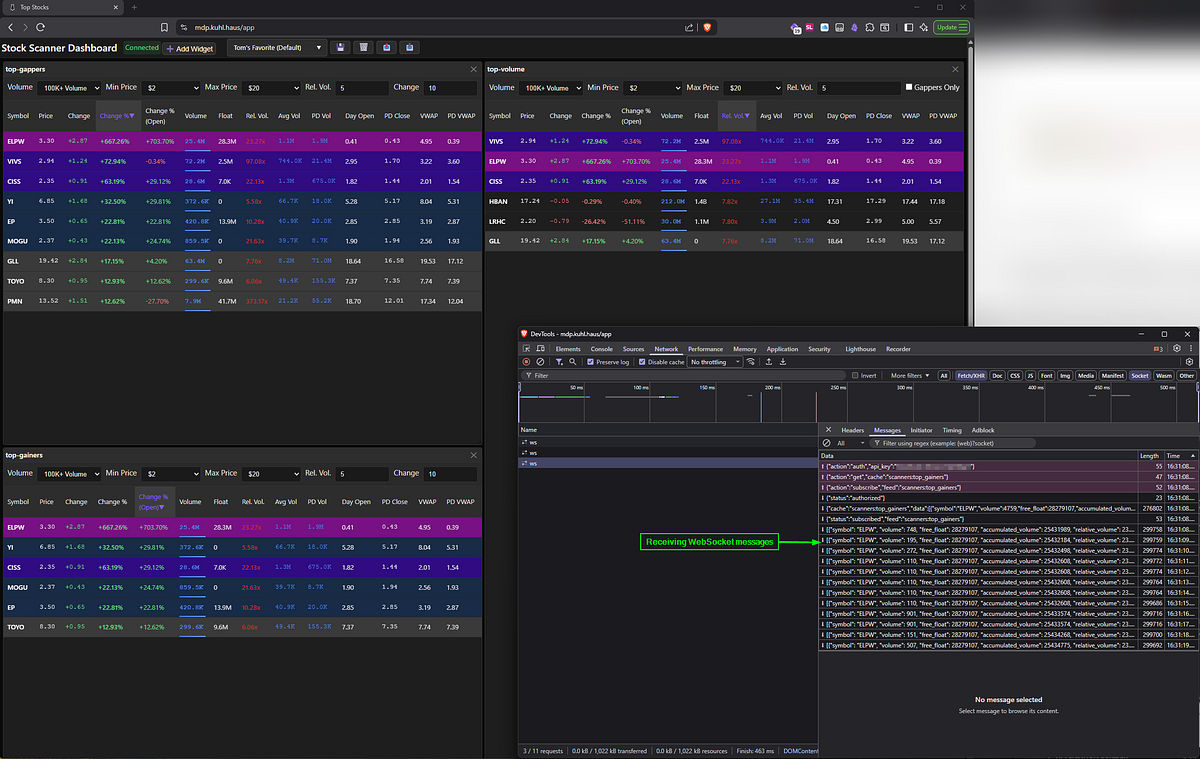
Dev tools showing WebSocket subscriptions
Each widget subscribes to specific cache keys. When the MDP updates Redis, the Widget Data Service pushes updates through the WebSocket, and the UI updates without polling.
This is the cool part: The entire data pipeline — from market feed to UI update — happens in near real-time. No database queries, no REST polling, just WebSocket push notifications driven by cache updates.
And it all just worked on the first deployment.
Cost Optimization (Or: How to Cheap Out If You Must)
Look, I’m not going to pretend I’ve tested every penny-pinching configuration. I run the $199/month plan because I want real-time data and I’m not broke. But if you’re absolutely determined to save a few bucks, here are some half-assed guesses that might work.
Downgrade your market data plan:
Don’t need real-time updates? The $29/month Stocks Starter plan gives you delayed data and daily statistics. You lose the second-by-second scanner updates, but you can still run end-of-day analysis and historical scans.
Trade-off: Your scanner shows what happened, not what’s happening.
Switch from per-second to per-minute aggregates:
Change your subscription from A.* (all tickers, per-second) to AM.* (all tickers, per-minute):
# ansible/group_vars/all.yml

massive_subscriptions:
  - "AM.*" # Per-minute instead of per-second
Theory: 60x fewer messages means 60x less CPU and bandwidth. Should save you money on cloud hosting.
I’ve actually tried this. It works, but it’s slow. You’re getting updates once per minute instead of every second. Suboptimal for day trading. Fine for end-of-day longer time frame analysis.
Other ideas I haven’t tried:
- Run the scanner only during market hours (9:30 AM — 4:00 PM ET). Schedule your Kubernetes pods to scale down outside those hours.
- Subscribe to fewer tickers. If you only trade a few stocks, why pay to process data on thousands of symbols?
- Use cheaper cloud instances. This runs fine on small VMs — you don’t need a beefy server.
Again: I don’t run any of these configurations. They’re educated guesses. If you try them and they work, great. If they don’t, you get to keep both pieces.
Conclusion
The Reality Check
Let’s be honest: this deployment isn’t trivial. Ansible playbooks, Kubernetes manifests, networking configs, and more YAML than any reasonable person should endure. If you hit roadblocks, that’s normal. Infrastructure work is hard, and anyone who tells you otherwise is selling something.
But here’s what matters: you just deployed a production-grade real-time stock scanner to Kubernetes.
Is it perfect? No. Will you need to tweak it? Absolutely. Should there be monitoring and alerting? Yes, and we’ll get there. But right now, you’ve got market data flowing through a multi-component pipeline, updating in real-time, with proper health checks and version verification.
That’s a hell of a starting point.
What’s Next
This series isn’t done. Coming up:
- The Market Data Processor internals — How I calculate relative volume, track daily statistics, and maintain top 500 rankings efficiently
- WebSocket challenges — Handling reconnections, backpressure, and ensuring data consistency in real-time streaming applications
If you made it this far, you’re either deploying this thing or you’re a masochist. Either way, thanks for reading.