What I Built After Quitting Amazon (Spoiler: It’s a Stock Scanner)
After over 10 years at Amazon, I quit my job as a Senior Software Development Engineer in March 2025. Why I quit isn’t important right now. What matters is what I’ve been up to for the past 10 months.
📖 Stock Scanner Series:
- Part 1: Why I Built It (you are here)
- Part 2: How to Run It
- Part 3: How to Deploy It
- Part 4: Evolution from Prototype to Production
- Part 5: Bugs, Bottlenecks, and Breaking 1,000 msg/s
The Python Trading Book That Wasn’t
I started with what seemed like a solid plan: buy a book on algorithmic trading with Python. Easy, right? I’m a software engineer. I know Python. Let’s automate some trades and make money while I sleep.
Turns out, the book was written for finance people who’d never seen Python before. I don’t need an entire chapter explaining how to load a DataFrame in pandas. I never finished that book.
But here’s what I did learn: I didn’t know shit about the stock market. WTF is Fundamental Analysis? Technical Analysis? VWAP? Float? Shelf registration? 10-K/10-Q? Yeah, I’d heard some of those terms before, but I was totally out of my depth.
Down the Day Trading Rabbit Hole
I realized I didn’t know what I didn’t know. Time to actually learn about active trading. Trial and error seemed like the best way to lose money fast, so I decided to find an active trading strategy that was proven to work.
I dabbled with swing trading and options but ultimately focused on momentum day trading. I went all-in on Ross Cameron’s strategies — I use his tools (Day Trade Dash) alongside TradingView, where I run custom indicators including my own Momentum Indicators PineScript. I watch his screencast every morning to see how he applies these strategies in real-time. (Check out Warrior Trading if you’re interested. The guy is legit.)
Ross provided the criteria he uses to select stocks for his day trading strategies:
- Price between $2-$20 (sweet spot for me is $3-$7)
- Low float (10M shares cold market; 20M hot market)
- Up at least 10% on the day
- 5x relative volume
- Fresh news catalyst
He calls it the “Five Pillars of Stock Selection,” and it became the criteria for what I set out to build.
Building My Own Scanner (Because 4:30 AM)
Here’s the thing: I’m on the West coast of the United States and getting up at 4:30 AM to trade pre-market is not my idea of a good time. I still want to automate this stuff so I can make money while I sleep. So I built my own stock scanners aligned with my current strategies.
Let me be clear — this isn’t meant to replace my professional trading tools. Right now, it’s a proof-of-concept to validate that I can build a scanner to find stocks for a particular strategy. If I’m successful, my scanner should show me the same stocks that I find when I use my professional tools. The ultimate goal? Build my own algo-trader and use Lightspeed’s API to actually trade stocks automatically.
I released the code on GitHub under my Kuhl Haus org with an MIT license — meaning you’re free to use it, modify it, and even commercialize it however you see fit. I thought it would be fun to share the code once I got a working prototype and then write about it as I continue to develop it. The public Docker images are what I use for my own self-hosted stock scanning service. I’m building in the open and adding features as I go, and this blog is where you’ll find my latest developments on the project.
You’re more than welcome to use my code and open pull requests. That said, I’m building this specifically for my trading strategies and workflow — I’m not turning it into a product or providing broad support for different use-cases. If your needs diverge from mine, I actively encourage you to fork the repository and customize it for your strategies. That’s the beauty of open source and exactly why I chose the MIT license.
Before you dive in, there are two important things to know about running this scanner:
- Setup: I’ve written a guide showing you how to spin this up on your development machine using Docker Compose.
- WARNING: This doesn’t use free data. I’m currently using a $200/month Stocks Advanced plan from Massive.com for real-time WebSocket data. A $29/month Stocks Starter plan might work but the data is delayed 15 minutes. The free Stocks Basic plan won’t cut it.
The Architecture (For the Nerds)
I want to pull up a dashboard and see what stocks are moving RIGHT NOW.
Not 15 minutes ago.
Not the top gainers today as of noon.
Moving up fast. Right now.
Which means that I need actionable data from something that scans in real-time, guzzling market data from a firehose and spitting out results within seconds.
I searched for existing open-source stock scanners to find inspiration but largely found things that use free data and run on your PC. That is, you start the application, configure it, and then wait for it to SLOWLY pull data from Yahoo and other parts of the Internet. That is probably OK for swing trading and buy-and-hold strategies. That’s not for me. Too. Damn. Slow.
What I built is a whole different animal. This is not a single script or executable that you run on your PC. Rather, it consists of a Front-End Single Page Application (SPA) served via py4web and a microservices data plane for handling market data. Building and deploying a production-grade instance is a project in itself. Here’s the high-level architecture (with full deep-dives coming in future posts).
Application Front-End
Py4web is a framework for rapid development of secure database-driven web applications. Py4web handles static content and authentication, serving up a Vue.js-based SPA that displays market data via three drag-and-drop widgets: TopGainers, TopGappers, and TopVolume. The widgets can be sized and arranged arbitrarily and layouts can be saved, deleted, imported, and exported.
The widgets filter data by default to only show stocks that meet the Five Pillars criteria. (Currently, filtering works for price, percent change, relative volume, and total volume. Float is experimental, and news integration isn’t ready yet.) Stocks that don’t meet the criteria are filtered out, but you can adjust the filter controls to reveal the full top 500. The tables can be sorted by any column — simply click on a column heading to sort.
Note: I don’t trade penny stocks so I only display prices with two decimal places. Any stock that is priced less than 1 cent is displayed as $0.00.
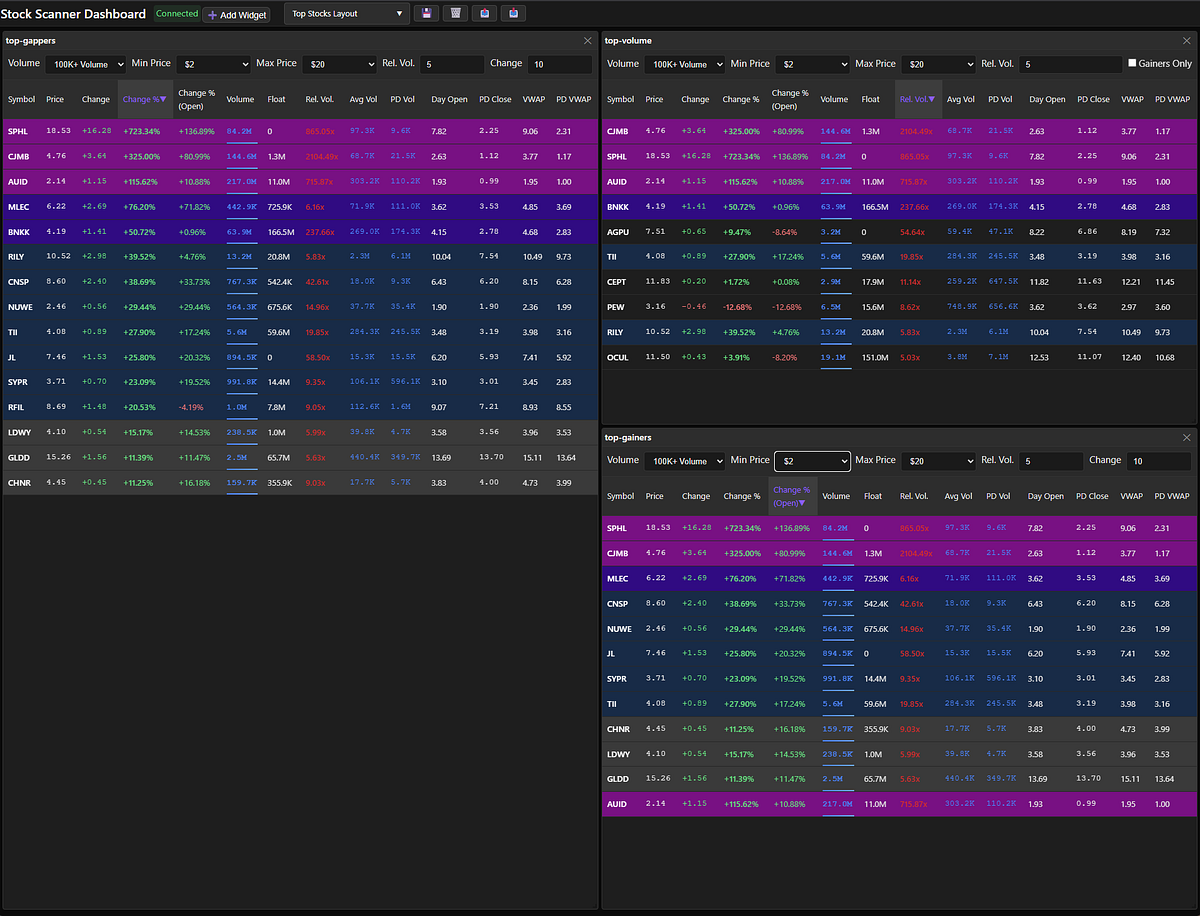
Stock Scanner Dashboard with the TopGappers, TopGainers, and TopVolume widgets displayed.
The background colors are based on the percentage gain. The bands are at 10%, 20%, 50% and 100%. I don’t know the names of the colors so I’ll just use a screenshot to show which is which.
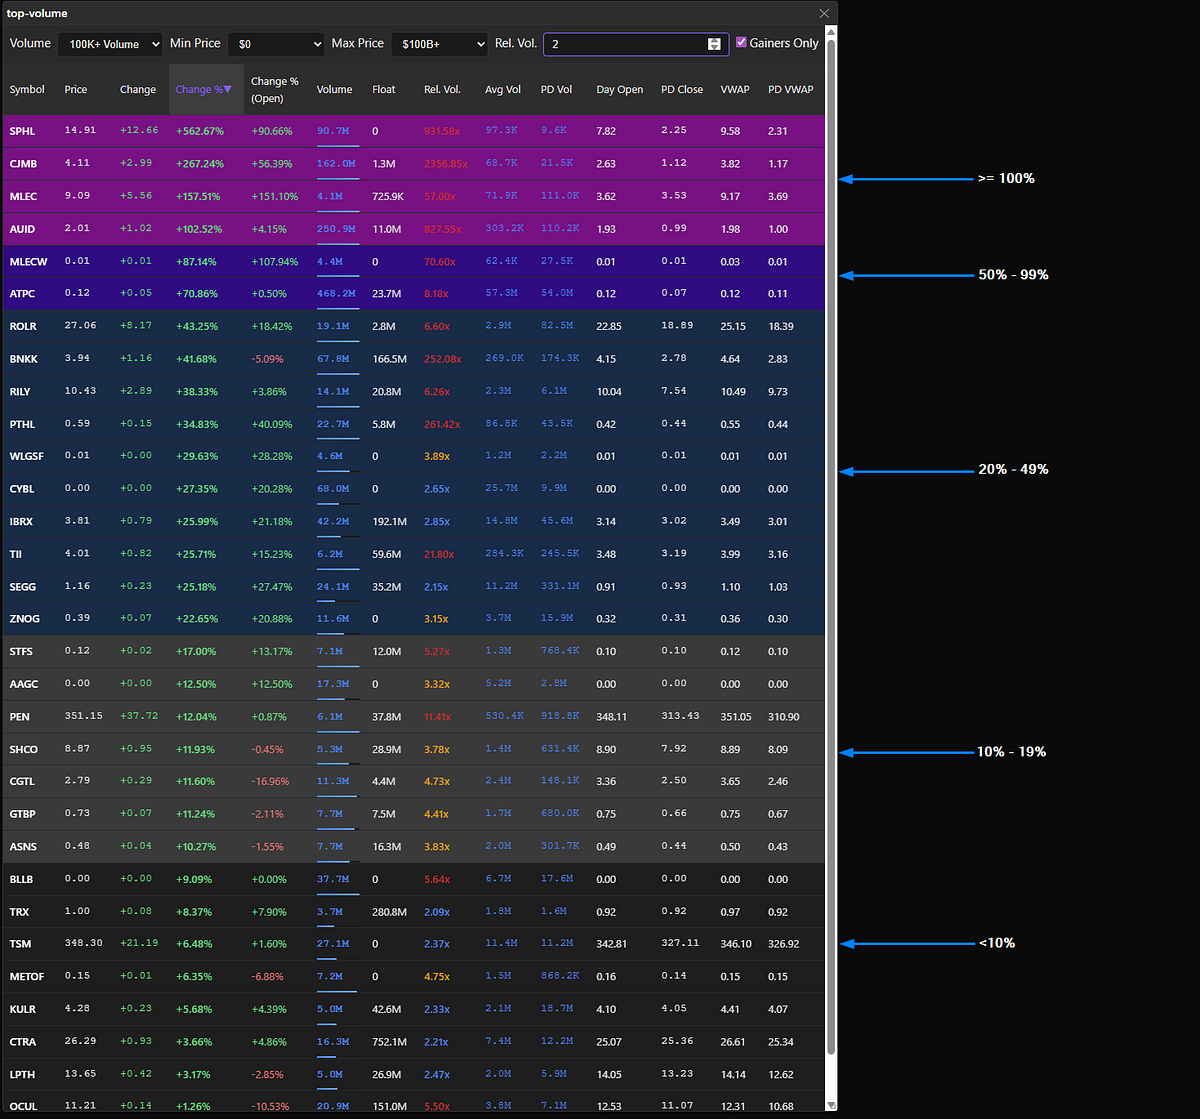
Color band visualization showing the progression from 10% (dark gray) to 100%+ (bright purple) gains
For you fellow nerds, this is the CSS:
.ten-percent-gainer { background: rgba(61, 61, 61, 0.9); }
.twenty-percent-gainer { background: rgba(18, 44, 75, 0.9); }
.fifty-percent-gainer { background: rgba(50, 4, 141, 0.9); }
.hundred-percent-gainer { background: rgba(136, 4, 141, 0.9); }
TopGappers
Gappers are stocks that open higher during the pre-market session than they closed in the previous regular session. A stock is called a “gapper” because it exhibits a significant price gap between its previous closing price and its current pre-market price, often due to news or events occurring outside regular trading hours. Gappers signal potential momentum plays — the stock is already moving before the market even opens, which often means strong catalysts are at work.
The TopGappers widget displays the top 500 stocks sorted by change since yesterday’s close. The left side shows an unfiltered view, while the right side shows the default filtered view.
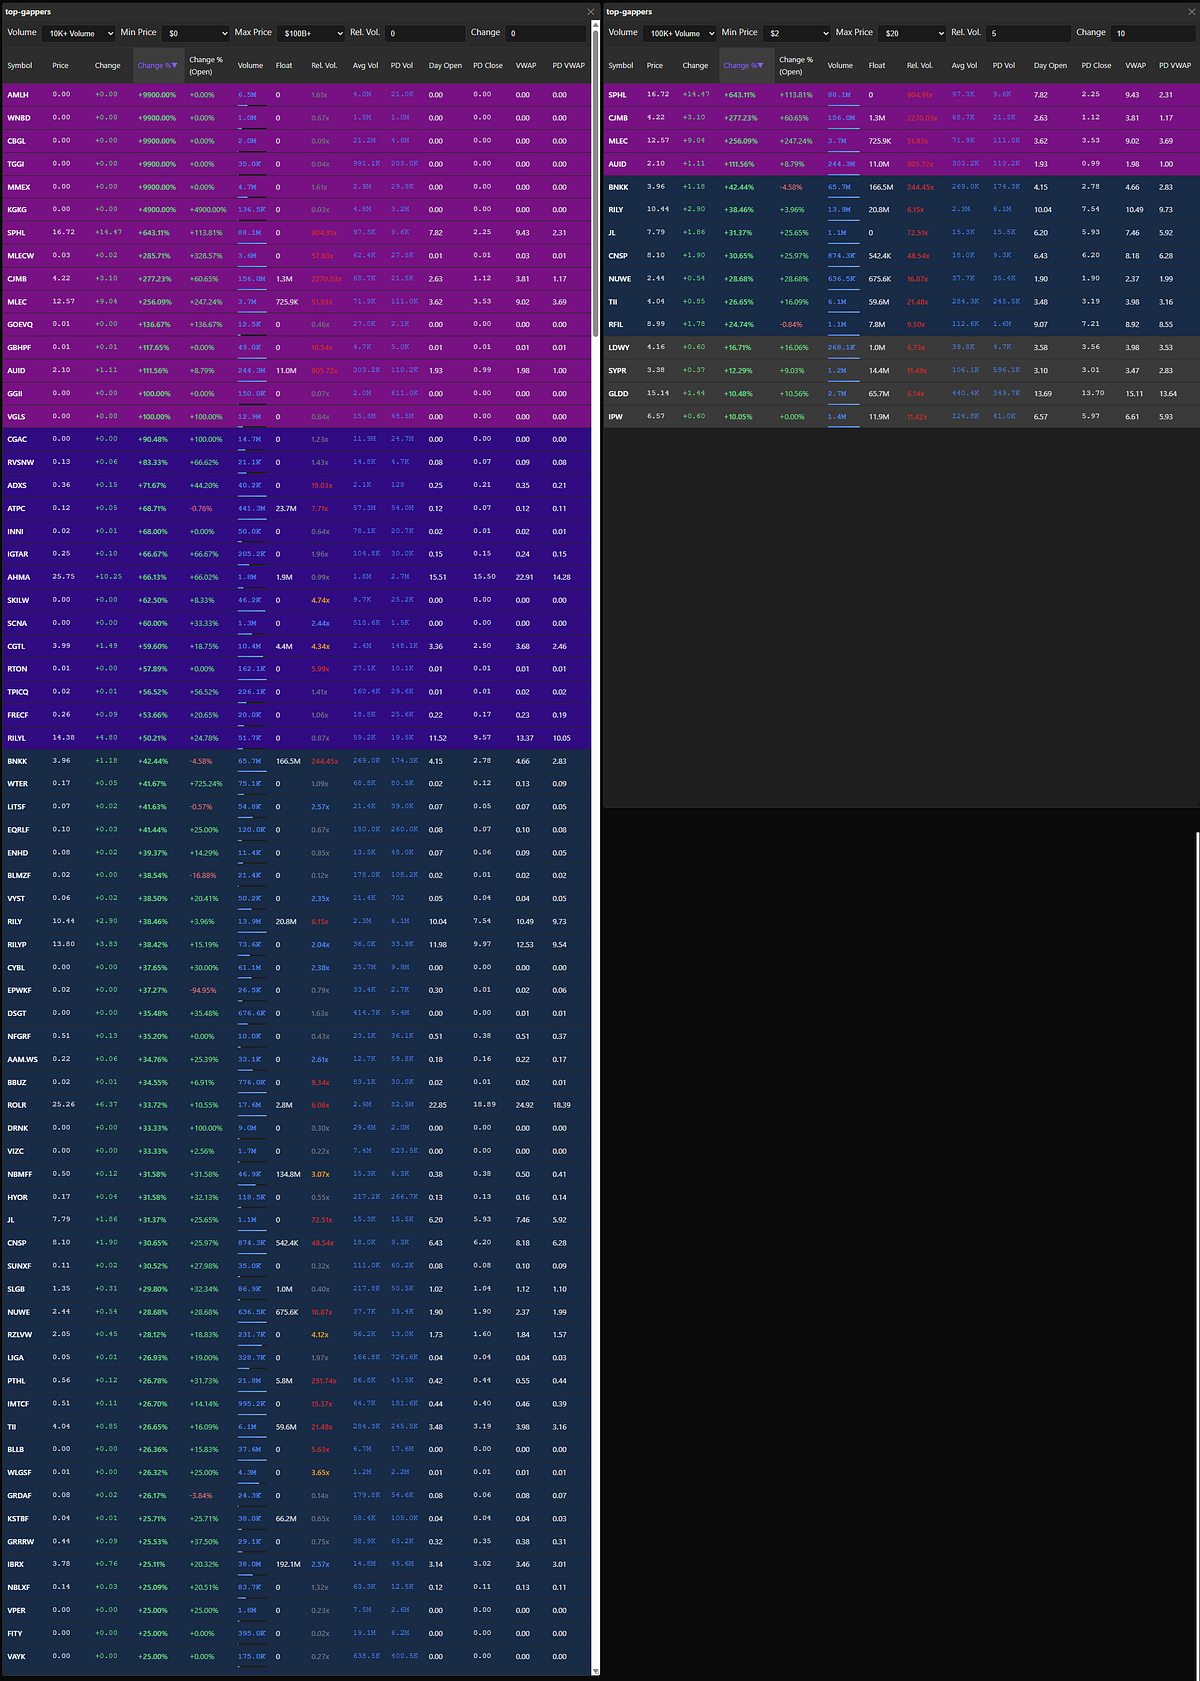
TopGappers side-by-side. Unfiltered view on the left. Default filters on the right.
TopGainers
Gainers are stocks that are trading higher than their opening price during the regular market session. In contrast to “gappers,” a “gainer” starts trading at its opening price and then moves higher during the regular session. The key difference is timing and cause: gappers are defined by a price jump between sessions, while gainers rise within the current session from the open.
Here’s the critical insight: not all gappers are gainers. A stock can gap up 20% in pre-market on positive news, but when the regular session opens at 9:30 AM ET, everything changes. Market orders flood in, stop losses trigger, and suddenly that 20% gapper plummets to only 5% above yesterday’s close — or worse, goes negative. The opening bell is when real price discovery happens, as retail traders and institutional orders hit the market simultaneously. A stock that looked incredible pre-market can become a disaster within the first 60 seconds of regular trading.
This is why I track both. TopGappers shows me what moved overnight and what’s getting attention in pre-market. TopGainers shows me what’s actually holding momentum once the full market weighs in. If a stock appears in both widgets, that’s a strong signal — it gapped up AND maintained or extended its gains after the opening volatility. That’s the momentum I want to trade.
The TopGainers widget displays the top 500 stocks sorted by change since today’s open and has the same filter controls as TopGappers.
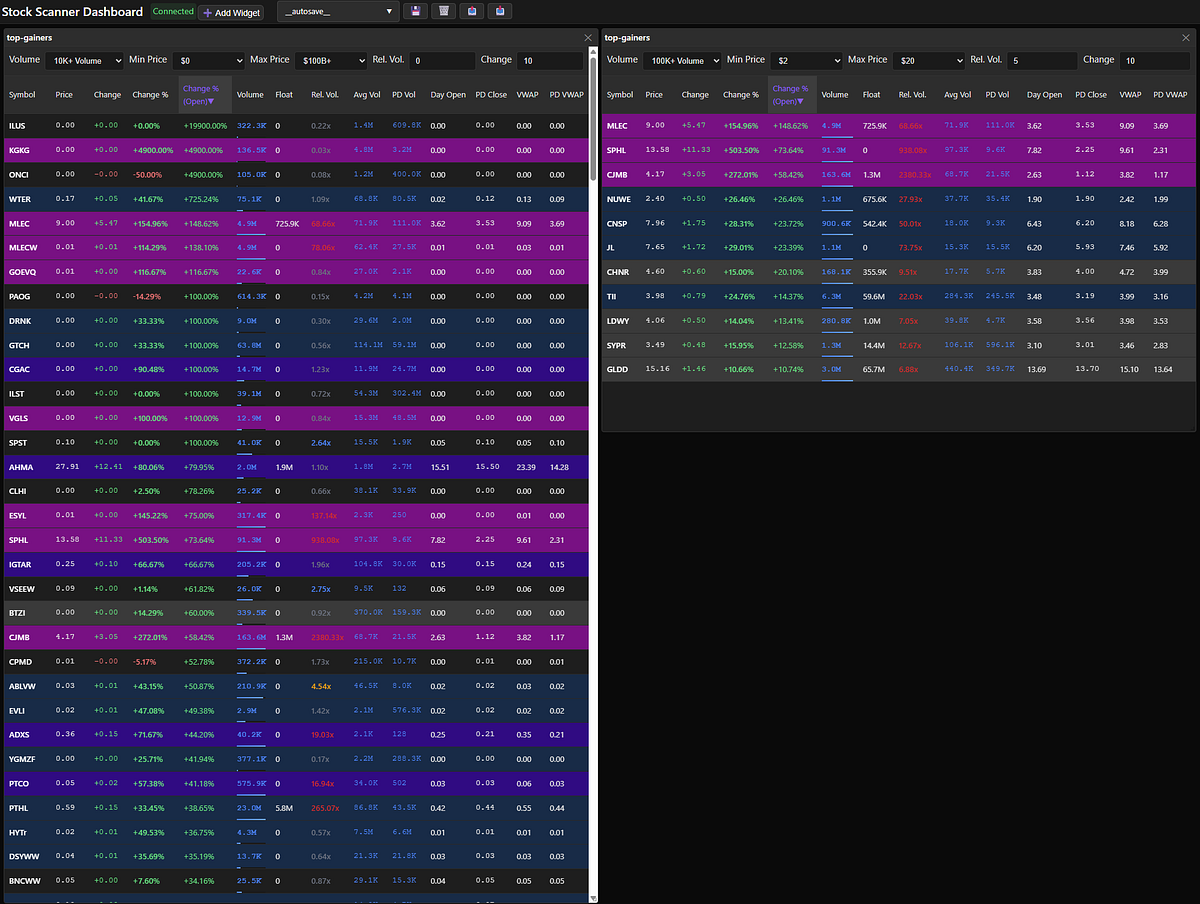
TopGainers side-by-side. Unfiltered view on the left. Default filters on the right.
TopVolume
The TopVolume widget displays the top 500 stocks by accumulated volume on the day — including the pre-market session. Out of this huge sea of high-volume stocks, what are we looking for? Unusual volume. That’s why the TopVolume widget is filtered to show stocks with five times the average trading volume by default.
The idea here is to see where all the trading volume is going. The highest-volume stocks are going to be the “most obvious” stocks to trade — it’s where the entire market is focused. For example, SPY, NVDA, QQQ, and TSLA appear in the top 500 by volume every single day. But here’s where it gets interesting: CJMB normally gets 69K of volume per day but is now trading 176.9M shares on a 1.3M share float. That’s unusual. And look — it’s up 195% since yesterday’s close. Same thing with SPHL. Over 1,000x relative volume and up over 574%! Wow!
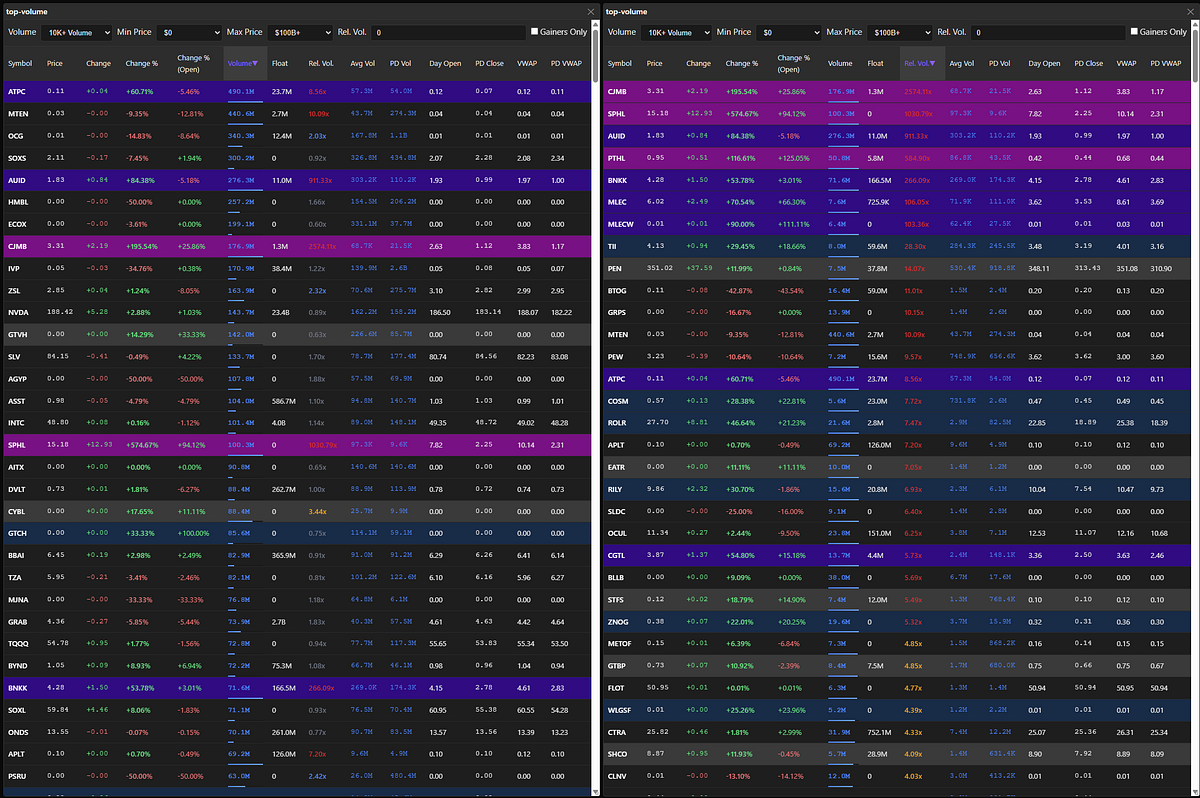
Top 500 volume sorted by volume (left) and relative volume (right)
The TopVolume widget has similar filter controls as the TopGappers and TopGainers widgets, with one key difference: the inability to set a fixed percentage gain threshold. Unlike TopGainers and TopGappers, the TopVolume widget shows both gainers and losers. Instead of setting a threshold for percentage gain, there’s a checkbox labeled ‘Gainers Only’. (As I’m writing this, I just realized the checkbox should actually say ‘Gappers Only’ because that’s the behavior I implemented.)
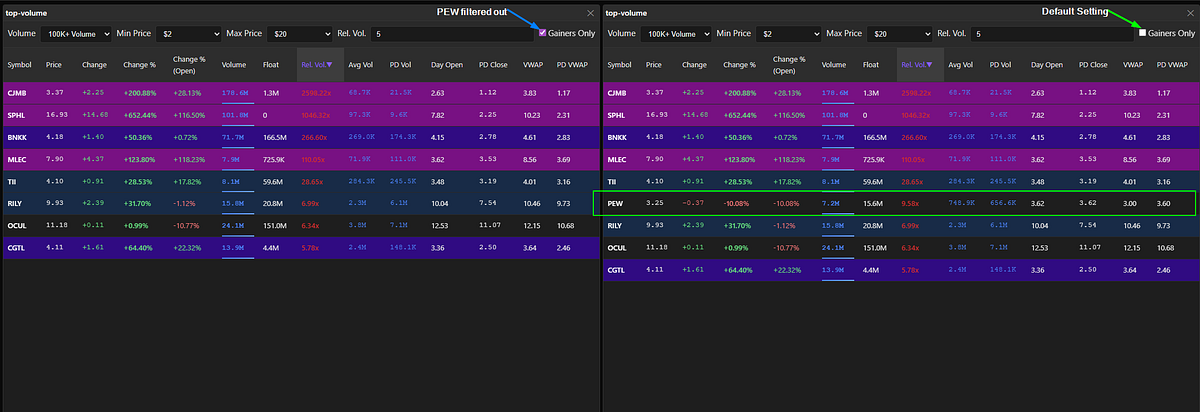
Checking ‘Gainers Only’ filtered PEW from the list.
Here’s the key insight: when you compare the same 500 stocks sorted by raw volume versus relative volume, notice the dramatic difference. Sorting by relative volume reveals a much higher concentration of 10%+ gainers. This validates a core principle of momentum trading — unusual volume relative to a stock’s typical activity is a far better signal than raw volume alone. The stocks experiencing 5x, 10x, or 20x their normal volume are the ones making significant moves, even if their absolute volume doesn’t crack the top of the raw volume rankings.
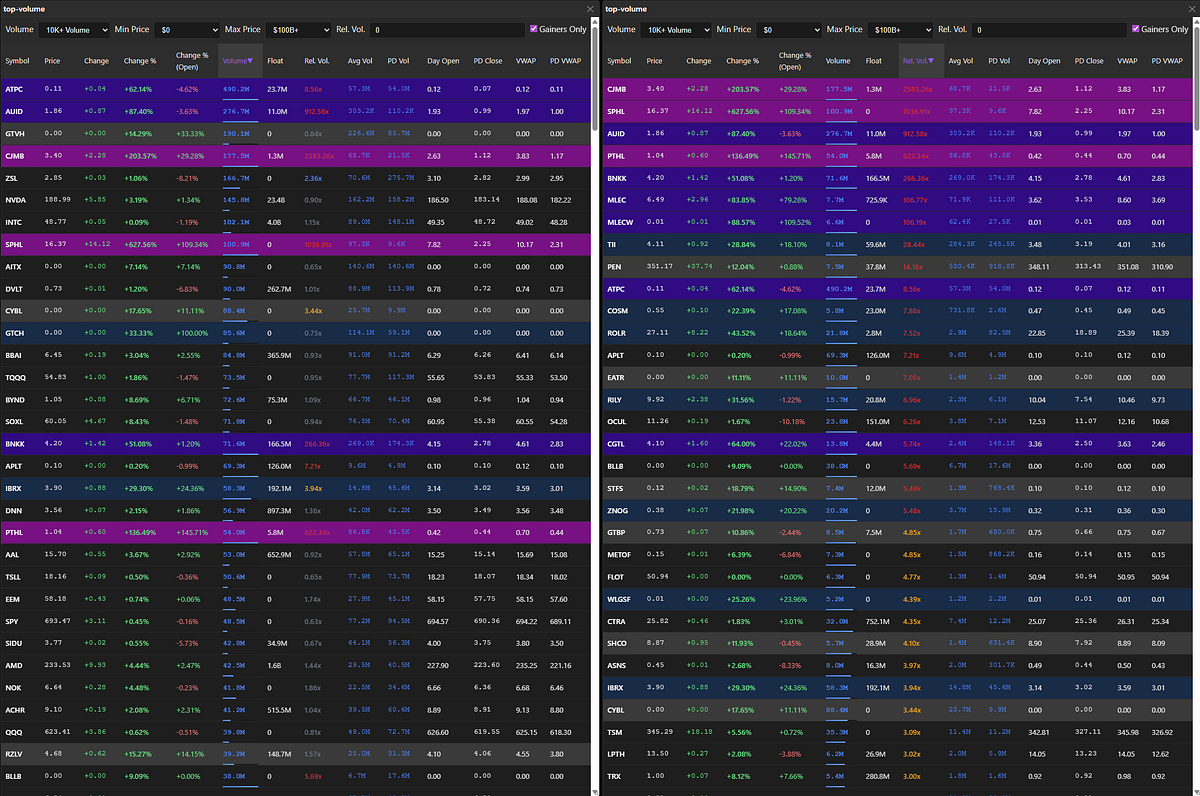
Comparison: Top 500 stocks sorted by volume (left) versus relative volume (right), showing higher concentration of significant gainers when sorted by relative volume
Data Plane:
Now here’s where it gets interesting from an engineering perspective. Those widgets updating in real-time? That requires a robust data pipeline that can receive 1,000+ market data events per second, process them concurrently, and push results to your browser within seconds.
The data plane consists of three Python-based FastAPI services working in concert. The Market Data Listener receives raw market data via WebSocket from Massive.com and immediately fans out different event types (trades, quotes, bars) to dedicated RabbitMQ queues. This fan-out pattern is crucial — it lets me horizontally scale the next component without creating bottlenecks.
The Market Data Processor is the brain of the operation. It consumes events from those queues, maintains running calculations for all tracked symbols, and continuously identifies the top 500 stocks across multiple dimensions (gainers, gappers, volume). Think of it as constantly re-scanning thousands of stocks and updating leaderboards in real-time. Because it reads from queues, I can spin up multiple processor instances to handle increased market activity during volatile sessions.
Finally, the Widget Data Service bridges the processed data to your browser. It subscribes to Redis pub/sub channels where the processor publishes scanner results, and it serves those updates via WebSocket to the SPA. When you first load the dashboard, it also fetches the current cached state from Redis so you see data immediately — no waiting for the next update cycle.
RabbitMQ handles the queuing and Redis provides both caching and pub/sub streaming. Together, they enable the horizontal scalability and real-time performance that makes this scanner actually useful for day trading.
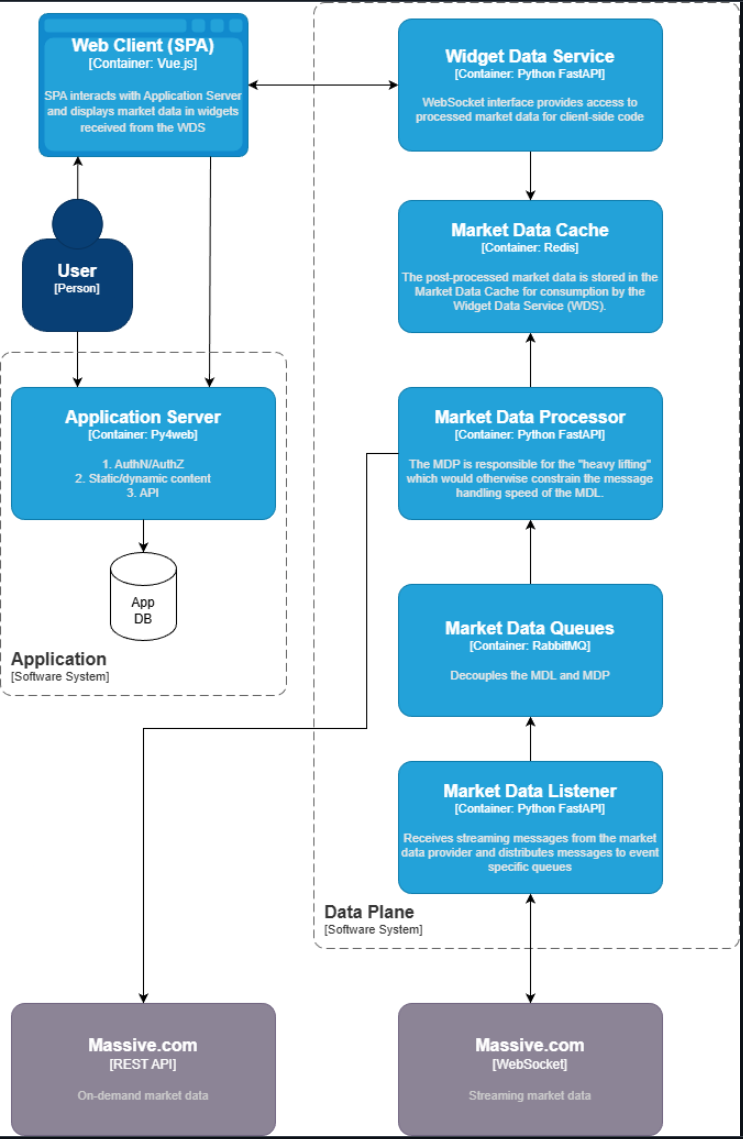
Architecture diagram showing the application server with SPA connected to the three-service data plane via WebSocket
This architecture isn’t just over-engineering for fun. During active trading, I’m processing 1,000+ events per second and delivering updated scanner results within 5 seconds. A simple single-threaded script pulling data from Yahoo Finance wouldn’t have a prayer. This distributed design scales with market activity and delivers updates fast enough to actually be actionable for day trading.
What’s Next
This post covered the “what and why” of my stock scanner. In upcoming posts, I’ll go deep on the “how”:
- The Market Data Processor internals: How I calculate relative volume, track daily statistics, and maintain top 500 rankings efficiently
- Deployment and infrastructure: Docker Compose for local development, production deployment strategies, and cost optimization
- WebSocket challenges: Handling reconnections, backpressure, and ensuring data consistency
- Building your own: Step-by-step guide to running this on your machine and customizing it for your strategies
I’m building this in the open on GitHub under the Kuhl Haus org. If you’re interested in algorithmic trading, real-time data processing, or just want to see how a production scanner is built, follow me on GitHub. I’ll be documenting every technical decision, mistake, and breakthrough as I work toward the ultimate goal: a fully automated algo-trader.
And hey, if you’re also a West Coast trader who refuses to wake up at 4:30 AM, maybe this will inspire you to build your own solution too.