What I Built After Quitting Amazon (Spoiler: It’s a Stock Scanner) — Part 4
The Evolution from Prototype to Production: A Case Study in Deliberate Design Iteration
📖 Stock Scanner Series:
- Part 1: Why I Built It
- Part 2: How to Run It
- Part 3: How to Deploy It
- Part 4: Evolution from Prototype to Production (you are here)
- Part 5: Bugs, Bottlenecks, and Breaking 1,000 msg/s
Introduction
Parts 2 and 3 were straight-up instruction manuals. Necessary, but not exactly page-turners. The DevOps geek in me couldn’t open-source code without proper documentation — it’s a compulsion. But now we get to the interesting stuff: how I took a deliberately simple proof-of-concept and systematically evolved it into a production-grade system that can handle 1,000+ events per second without breaking a sweat.
The Philosophy of Intentional Simplicity
When you’re building something complex from scratch, there’s a temptation to over-engineer. You start designing for scale you don’t need yet, implementing patterns for problems you haven’t encountered, building abstractions for requirements you haven’t validated. That’s how projects die before they launch.
My approach: build the simplest thing that proves the concept, measure it, then iterate based on data. The PoC was intentionally janky — simple data structures, obvious bottlenecks, single-process constraints. I knew exactly what would break and where. The point wasn’t to build the final system; it was to validate the architecture and identify the real bottlenecks through observation, not speculation.
Why Microservices? (And Why It Actually Matters)
Before we dig into the evolution, let’s address the architectural elephant in the room. Microservices are inherently more complex than monoliths — more moving parts, harder to debug, operational overhead. So why choose that path?
I knew from the start I needed real-time WebSocket updates on the frontend. I’d prototyped with py4web but wasn’t married to it. I considered HTMX briefly, but settled on a JavaScript framework for the frontend since AI tooling would be more helpful there. That meant WebSockets, which py4web doesn’t implement natively.
Sure, I could hack WebSocket support with FastAPI as a sidecar. But once you’re running sidecar containers, you’re not building a monolith anymore — you’re building a tightly-coupled hybrid architecture. And that’s the worst of both worlds.
Here’s the thing: authentication, user management, and serving static content are completely different concerns from processing real-time market data at 1,000+ events per second. Why tightly couple the technology stacks when the problem domains are fundamentally separate? Microservices gave me the flexibility to choose the best tool for each job and develop them independently.
The market data constraints sealed it: Massive.com limits you to a single WebSocket connection for all subscriptions. I can’t open separate connections for Trades, Aggregates, and News. I can’t filter to specific symbols. I have to consume everything they send, in bursts, without falling behind — or they disconnect me. That means I need horizontal scalability, which means distributed work queues, which means microservices architecture becomes the simpler choice, not the more complex one.
The Proof-of-Concept: Deliberately Simple, Intentionally Flawed
The PoC had two analyzers processing market data:
The Massive Data Analyzer consumed messages from RabbitMQ and republished them to Redis with zero processing. Pure passthrough.
The Top Stocks Analyzer subscribed to Redis channels, maintained three leaderboards (top gainers, top gappers, top volume) in dictionaries, and sorted them once per second.
I knew this design had problems:
- Wrong data structure for rankings: Dictionaries give O(1) access but require O(n*log(n)) sorting to maintain rankings. Priority queues or sorted sets would be better, but I wanted to validate the architecture first.
- Processing messages twice: RabbitMQ → Massive Data Analyzer → Redis → Top Stocks Analyzer. Inefficient by design, but it let me test different messaging patterns without rewriting the whole stack.
- Single-process constraint: The Top Stocks Analyzer couldn’t scale horizontally because it held all state in memory.
These weren’t oversights. They were conscious tradeoffs to get to a working system fast. The PoC validated the architecture, confirmed the data flow patterns, and — most importantly — ran long enough to reveal the real bottlenecks.
The Stampeding Herd Problem: When Elegant Degradation Meets Reality
Here’s what I discovered: every morning at 6:30 AM Pacific, the scanner crashed like clockwork.
The behavior was consistent enough to set a watch by, but I didn’t have the data to explain why restarting it actually fixed the problem. No distributed tracing. No metrics. Just console logs and educated guesses.
The culprit turned out to be an interaction between two design decisions:
RabbitMQ’s graceful degradation: I configured it to buffer messages for 5 seconds max, silently discarding old messages if processing fell behind. This was intentional — I wanted data freshness over completeness. If the processor got overwhelmed, the WebSocket clients would get slightly stale data instead of a backed-up flood of outdated information.
The cache reset at market open: When the official opening price arrived, the Top Stocks Analyzer reset its entire cache to recalculate all the statistics based on the new baseline. Reasonable enough — except it happened simultaneously with the highest burst traffic of the day.
Here’s where the double-processing bit me: the Massive Data Analyzer was republishing everything from RabbitMQ to Redis, completely bypassing RabbitMQ’s graceful degradation. So when the Top Stocks Analyzer reset its cache right as the market opened, it got slammed with the full stampeding herd of accumulated messages. My elegant backpressure mechanism? Rendered completely ineffective by my own architecture.
The restart “fixed” it because reconnecting the Redis client cleared the backpressure just enough for the process to appear responsive again.
Adding Observability: Proving What You Suspect
You can’t optimize what you can’t measure. I spent a week adding observability to the stack, starting with the low-hanging fruit: zero-code OpenTelemetry instrumentation using environment variables and the opentelemetry-instrument wrapper. Minimal code changes, mostly in kuhl-haus-mdp-servers.
Is it comprehensive? Not yet. The core library doesn’t get auto-instrumented, and most of my FastAPI services just serve health checks anyway. But it lays the groundwork — once I add proper instrumentation to the core library, I’ll have full distributed tracing across the entire stack without reconfiguring the data plane.
For Kubernetes observability, I configured the OpenTelemetry Operator and used operator injection with annotations on the py4web frontend. Infrastructure metrics and logs? Check.
For application metrics, I built a custom Prometheus JSON exporter to scrape the health check endpoints. It runs as a sidecar, translates JSON payloads into Prometheus metrics via a config file, and exposes everything at /probe. Simple, decoupled, effective. I’ve open-sourced the JSON exporter and configuration for the masochists out there.
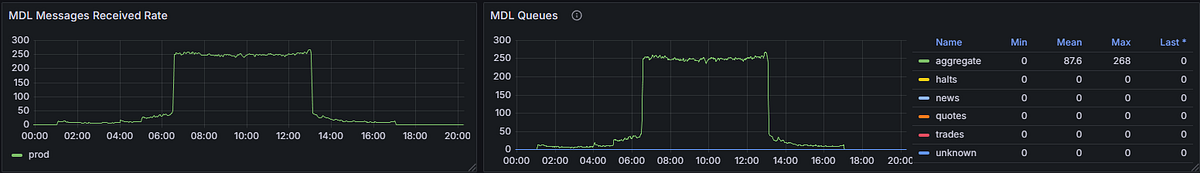
Graph showing MDL message send and receive rates
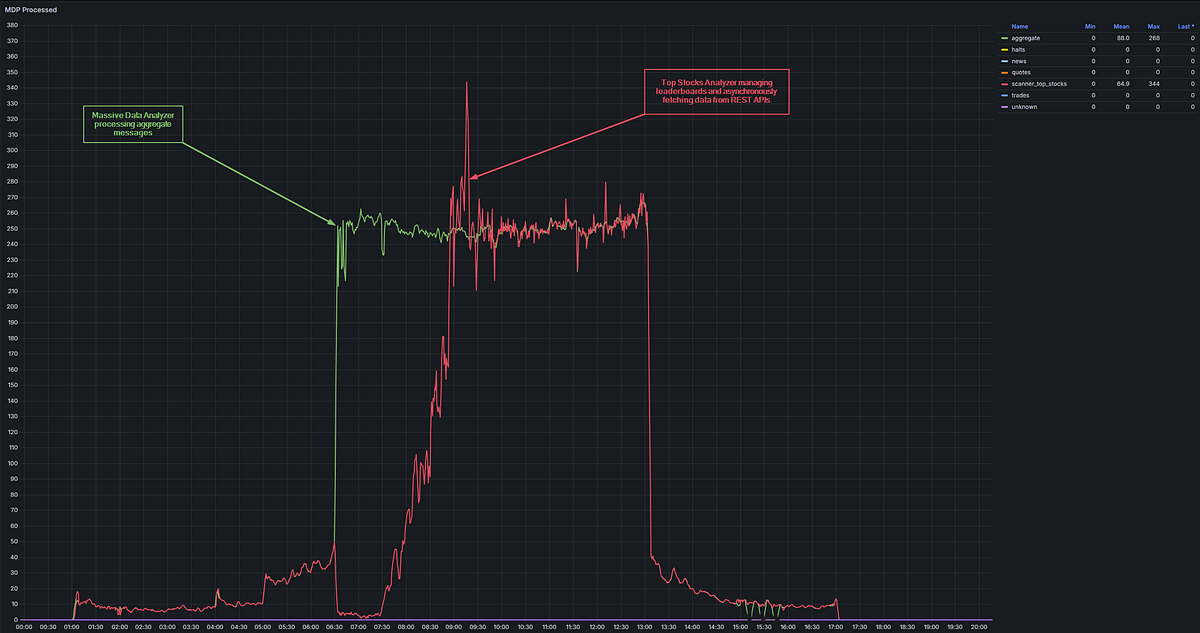
The PoC’s death rattle, visualized.
Rather than restart the MDP, I let it run and self-recover. The green line shows the Massive Data Analyzer humming along processing aggregate messages. The red line shows the Top Stocks Analyzer having a full-blown meltdown at market open (6:30 AM Pacific), flat-lining for an hour and then thrashing for the next two, finally recovering around 9:30 AM. Notice how the red line flatlines before rising sharply, spiking to 340+ messages/sec right as it recovers — classic stampeding herd problem.
This is what “crashes like clockwork” looks like in Grafana.
The data confirmed my suspicions and revealed some surprises:
- The dictionary sorts were expensive, as expected
- The double-processing overhead was worse than I’d estimated
- The stampeding herd pattern at market open was clear in the metrics
With hard numbers in hand, I could prioritize the rewrites systematically instead of guessing.
The Solution: Stateless, Horizontally Scalable, Redis-Backed
I killed the Top Stocks Analyzer entirely and replaced it with the Leaderboard Analyzer.
Key changes:
Redis Sorted Sets for rankings: Instead of dictionaries with periodic sorts, I’m using Redis sorted sets that maintain rankings natively. Updates are O(log(n)) and lookups are O(1). More importantly, the data structure lives in Redis, not in process memory.
Stateless design: Multiple Leaderboard Analyzer instances can run concurrently because they don’t hold local state. Each instance pulls from RabbitMQ, processes, and updates Redis. Horizontal scaling becomes trivial.
Single-pass processing: The Massive Data Analyzer is gone. The Leaderboard Analyzer consumes directly from RabbitMQ and publishes to Redis in one pass. The graceful degradation mechanism works again.
The morning crash? Gone. The scanner now runs continuously through market open without a problem.
Scaling Up vs. Scaling Out: Composability by Design
This is why kuhl-haus-mdp and kuhl-haus-mdp-servers are separate repos. The core library defines the data models and processing logic. The servers package implements different deployment strategies.
The MDP Server is designed to scale up — single instance, rich observability, health check endpoints that expose Prometheus metrics.
The LBA Server is designed to scale up and out — headless, no HTTP endpoints, pure message processing. Spin up as many instances as you need and crank up the parallelism while you’re at it.
Both use the same core library. Once I add programmatic tracing and metrics to the core, I can choose scaling strategies based on actual load patterns instead of guessing.
What I Learned
Building the PoC with intentional limitations let me validate the architecture fast and identify real bottlenecks through measurement, not speculation. The stampeding herd problem was something I could have predicted — but it was exacerbated from the interaction of seemingly reasonable design choices under actual production load.
The key was making the PoC simple enough to get working quickly, but instrumented enough to learn from. Now I have a system that handles peak market open traffic without crashing, scales horizontally when needed, and gives me the observability to optimize further.
Not bad for a few weeks of work and some systematic iteration.
What’s Next?
Sharp-eyed readers might’ve noticed something: I keep talking about 1,000+ events per second, but the dashboard screenshots show a max of 340 messages/second from the MDP. What gives?
I’ve got one more piece of code sitting in my private repo — a scanner I built during the PoC that I haven’t released yet. I needed to stabilize the foundation before adding more load to the system.
During the PoC, my first analyzer was based on Massive’s example code — it subscribed to the Trades feed and ranked stocks by number of trades, volume, and cash amount. My initial volume scanner consumed the raw Trades feed, but I discovered I could achieve all my scanning needs using just the Aggregates feed. That cut message processing overhead by 75%, so I shelved the Trades scanner.
Here’s the tradeoff: the Aggregates scanner is slow to detect momentum shifts. When I’m consuming the Trades feed, I can see MOMO (momentum) building in real-time — you catch the move as it’s happening, not after it’s already run. The Aggregates feed smooths everything out, which is great for stability but terrible for timing.
Now that the scaling problems are solved and the architecture can handle horizontal load distribution? Time to bring the Trades scanner back into the mix.
Next post — the finale of this series — I’m going to show you what this thing looks like running at full throttle with both scanners active. 1,000+ events per second, complete with metrics to prove every claim.
We’ve gone from “crashes every morning” to “ready for prime time.” Not a bad arc.